
TeeChart
以下是 "TeeChart Pro VCL/FMX",如果您需要了解更多信息,您可以联系我们。
提供高性能图表解决方案。
TeeChart Pro VCL allows you to create general purpose and specialized chart and graphing applications for all areas including business, engineering, financial, statistical, scientific, medical, real-time, and the web. TeeChart Pro VCL features a chart gallery with several chart types including 2D or 3D line, bar, horizontal bar, area, point, pie, arrow, bubble, Gantt, surface, volume, polar, and many more. Use the Chart Editor to customize your charts. TeeChart Pro VCL Source Code available.
TeeChart Pro VCL is a 100% VCL Charting Component Library providing general purpose and specialised Chart and Graphing applications for all areas including Business, Engineering, Financial, Statistical, Scientific, Medical, Real-Time and the web.
Trend, CurveFitting, Statistical and Financial Functions
Series and SubSeries Selection
TeeChart Gauges
TeeChart Mapping
3D Series Types

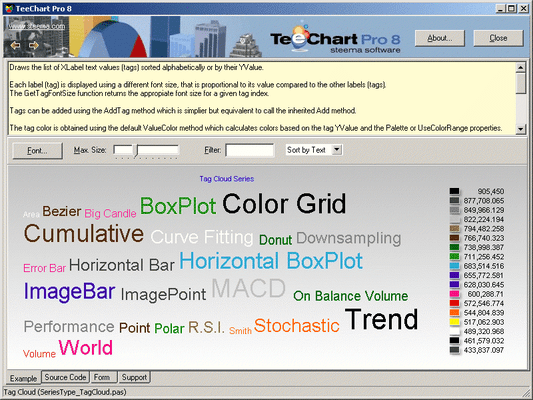
TeeChart TagCloud
One Source for Cross-Platform
Surface Chart
ActivityGauge
EqualizerSeries
Multiple Pies
3D Cylinder Chart
Weather
Demographics
Polar Chart
Marketing
Geographical
3D Surface Chart
Financial MACD Chart
World Map 3D
Sales
Multiple Areas Chart
Cylinder Chart
Interpolating Line Series
Series Region
Smith Chart
Financial A.D.X Chart
DataGrid Chart Tool
Magnify Chart Tool
Weather
3D Pie Chart
Bubble Chart
Basic Subtract Function
TeeChartVCL Areas
TeeChartVCL Polar
TeeChartVCL Gauge
RAD Studio 10 Seattle Support
TeeChartVCL Line Interpolate