TeeChart
以下是 "TeeChart Pro ActiveX",如果您需要了解更多信息,您可以联系我们。
创建高性能仪表板和图表解决方案。
TeeChart Pro ActiveX is a charting control for ActiveX aware programming environments such as Microsoft Office, Visual Studio's VB, VC++ and ASP, including Visual Studio.NET (VB.NET, C#). TeeChart ActiveX charting architecture and feature set has been built through years of interactive development with customers to create a charting component that offers an effective intuitive and timesaving programming interface. Steema TeeChart ActiveX Pro includes advanced features like create a Windows AVI standard video file from a Chart, playing videos (AVI,MPEG,DivX,etc) inside a Chart background, automatic map drawing, IsoSurface Series to draw a 3D surface mesh from a grid of XYZ points and many more. TeeChart ActiveX offers 25 Editor languages and is Unicode compliant for multi-characterset support, including double-byte languages, for true global application development. TeeChart ActiveX renders in most popular Graphics formats including JPEG, PNG and WMF/EMF and also generates Flex compiled code for on-the-fly Flash image generation, live with inline animations. TeeChart ActiveX also includes Gauges and Maps that can be used to create multi-task dashboards.
The TeeChart Pro ActiveX charting component library offers hundreds of Graph styles in 2D and 3D, 56 mathematical and statistical Functions for you to choose from together with an unlimited number of axes and 14 toolbox components. The Charting Control can be efficiently used to create multi task dashboards.
Plug-in Versatility
- The TeeChart ActiveX Chart Component Suite plugs into most COM compatible environments as a web chart in serverside libraries, a scripted ASP Chart or desktop application.
Easy to Use
- You'll see how easy it is to code TeeChart and how you can improve department development productivity.
More than just a Chart
- Includes Chart, Map & Gauge Controls plus thirteen toolbox components.
Steema’s Commitment
- Steema have been developing TeeChart since 1995, and endeavour to continue offering you the best tools for the job in the future.
Supported IDE's
- 32-bit / 64-bit ActiveX components
For Visual Studio .Net, Visual Basic, Visual C++, Delphi, Visual Studio 6, IIS / ASP.
Powerbuilder, MS Office Suite and many other Windows COM aware programming environments.
Fully scriptable under Internet Explorer using VBScript or JavaScript.
Supports VBA and ASP (Active Server Pages).
Server and Client Components
- Use the full power of the TeeChart ActiveX Control on the server: Database enabled and with all export formats for use in your ASP, ISAPI, CGI or MTS application. Direct stream output as a browser independent format or the lightweight AX client control for AX aware Browsers, with a fully navigable, event driven Chart to work interactively with server sourced data.
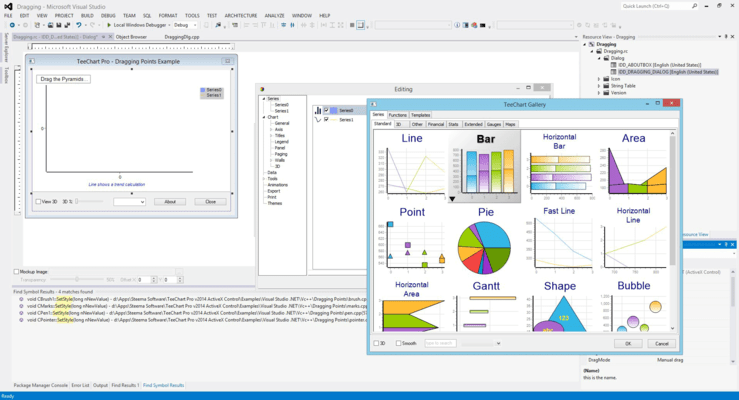
Chart Types
- 60+ chart types and variations including:
Standard: Line, Bar, Area, Pie, Fast Line, Point (Scatter), Bubble, Arrow, Gantt, Shape, Horiz. Line, Horiz. Bar, Horiz.Area.
Financial: Candle OHLC, Point and Figure, Volume, Volume Pipe, Darvas Boxes, EquiVolume.
Statistical: Ternary, High-Low, High-Low Line, Waterfall, ColorGrid, Histogram, Horiz. Histogram, Error, Error Bar, Error Point, BoxPlot, Horiz. BoxPlot, Funnel (Pipeline).
Extended: Surface, Contour, Polar, Radar, Donut, Smith, Pyramid, Tri. Surface, Vector 3D, Tower 3D, Point 3D, Bezier, Map GIS, Organizational, Treemap.
Other: Rose, Polar Grid, Wind Rose, Clock, Bar 3D, Bar Join, Image Bar, Image Point, Delta Point, Big Candle, Calendar, Bubble 3D, Tag Cloud, Bubble Cloud, Line Point.
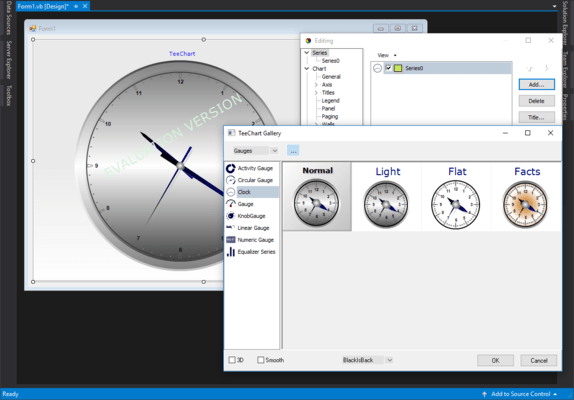
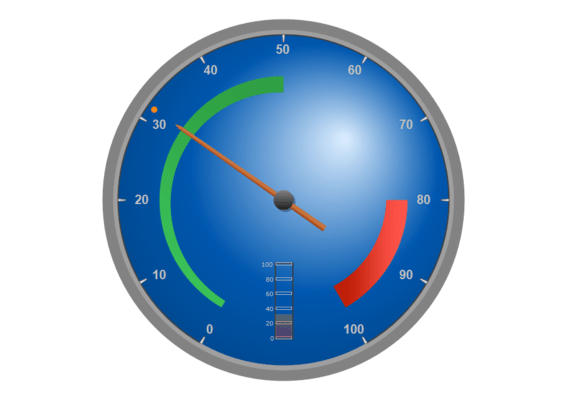
Gauges
- Gauges series type and indicators (Circular, Linear, Numeric, Knob and Combination) to display industrial instrumentation controls with lots of properties for fully customization.
Maps
- Provides a library of map series with properties and features for chart customization.
Functions and Indicators
- 50+ financial and statistical indicators including:
Standard: Add, Average, Count, Multiply, Divide, High, Low, Mode Function, Median Function, Pareto, Subtract, Subset, Custom y=f(x).
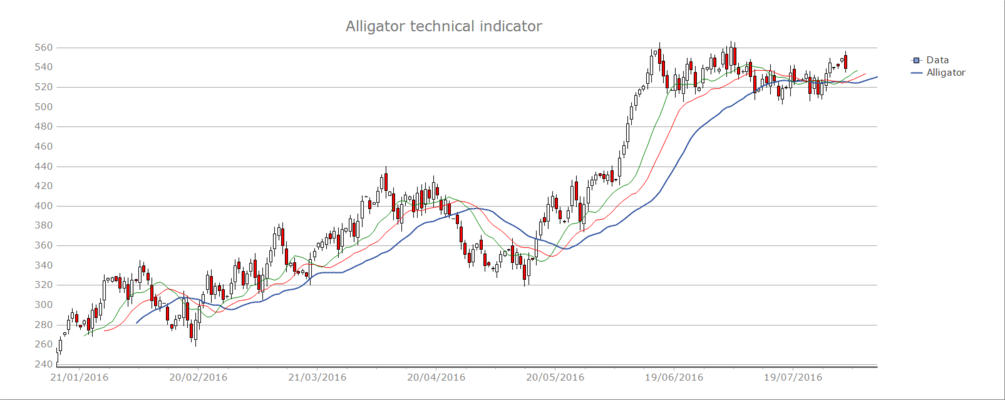
Financial: Accelerator Decelerator, ADX, Alligator, ATR, Awesome Oscillator, Bollinger Bands, Close Location Value, CCI, Compression, Gator Oscillator, MACD, Money Flow, OBV, R.S.I, RVI, SAR, Stochastic,Volume Oscillator.
Extended: Correlation Function, Cross points, Cumulative, Curve Fitting, Downsampling, Exponential Trend, Histogram, Perimeter, Smoothing, Trend.
Statistical: Centroid, Kurtosis, Percentage Change, Performance, Root Mean Square, Skewness, Slope, Standard Deviation, Variance.
Math: Exp. Moving Average, Momentum, Momentum Division, Moving Average, Smoothed Moving Average, Exponential Average.
3rd Party Compatibility
- 3rd party reporting tools and components are compatible with TeeChart such as: ActiveReports by GrapeCity and Crystal Reports by SAP Software and Solutions.
Data Connectivity
- You can easily create and/or connect to an existing database or dataset in your project. Data aware - Direct access to ADO data sources. Direct access to URL addressable Charts.
Chart Tools
- TeeChart includes a set of 51 tools for additional charting functionality, like Dragging series Marks, Annotation objects, Cursors and manual Trend lines, Colour Bands, SubCharts, etc.
Palette components
- The Palette provide access to 14 toolbox components including ChartGrid, Navigators, Web source and Control Bar.
Chart image filters
- You have control over the aesthetics of the charts with a set of 26 filters.
Exporting Formats
You can easily export charts as images (JPEG, GIF, PNG, BMP, PCX, SVG, PDF, EPS, VML, WMF/EMF and Flex/Flash formats) and as data to HTML, XML, Text, CSV and Excel formats.
Multi-language
TeeChart Editor dialogues translated to 35 languages. The translation can be used at design-time and run-time, and even with your custom application forms and texts.
Fast and Memory Efficient
- Chart Series internally use standard VCL Dynamic Arrays providing faster speed and less memory consumption.
- TeeChart graphical code speaks directly to Windows GDI API.
- Data is stored in dynamic arrays that are very closely mapped to memory which makes access and modifying the arrays almost as fast as the computer processor.
- Code is streamlined as much as possible to increase internal speed, especially when re-drawing.
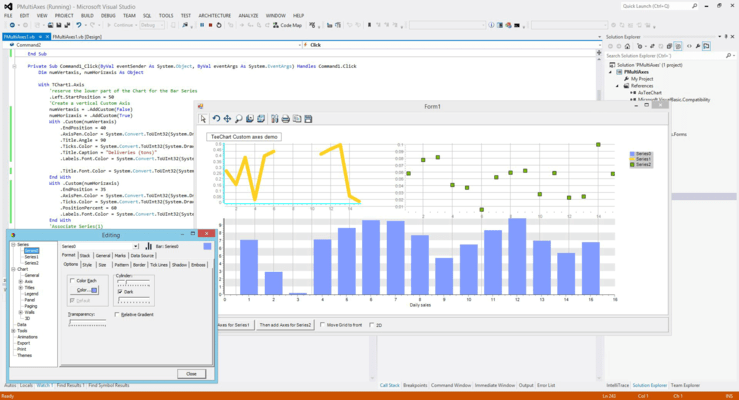
Multiple Axes
- Supports multiple axes, both Horizontal and Vertical in the same chart. There is no limit to the number of axes in just one chart.
Interactive Zooming and Scrolling
- Live and animated zoom and scroll. Mouse wheel supported.
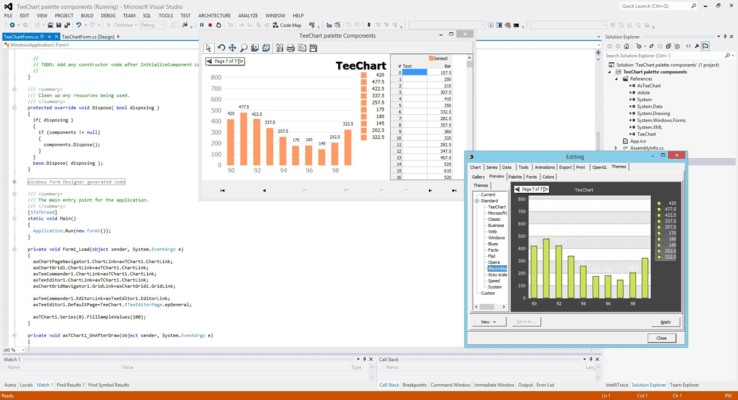
Chart Themes
- Includes 16 predefined themes enabling rapid change of many chart properties with a single mouse click.
Visual Attributes
- Customizable colour palette, Transparency, 3 color gradients, gray-scale. 2D, 3D plus OpenGL 3D with 360º rotation, lights and shadows. Custom drawing canvas.
Comprehensive Support
- Tech support provided via managed Steema Forums. Optional Professional-level technical support gives the subscriber a priority support link into Steema.
Royalty Free
You may distribute your charts royalty-free for use in compiled desktop applications. See the Software licensing contract to learn more about the use of TeeChart Pro ActiveX license.
Help and Documentation
- Includes extensive demo, code examples for Visual Basic, Visual FoxPro, Visual C++, Visual Studio.NET, ASP Server examples, Help, Tutorials, blog articles, TeeChart wiki, etc.
- Issue Tracker offers an interactive way of entering and monitoring TeeChart issues.
Many Chart Types.
Financial and Statistical Functions.
Gauges Types.
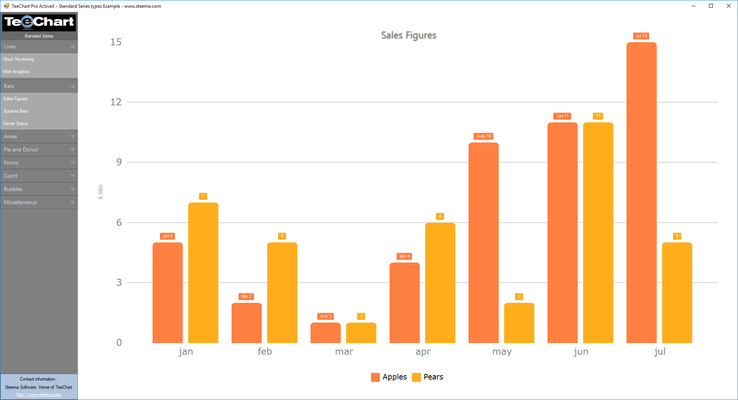
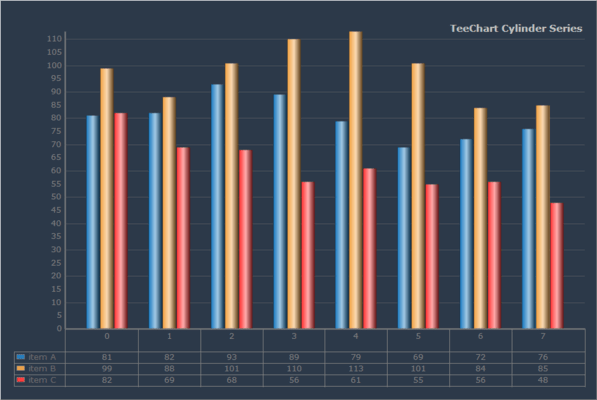
Bar Chart
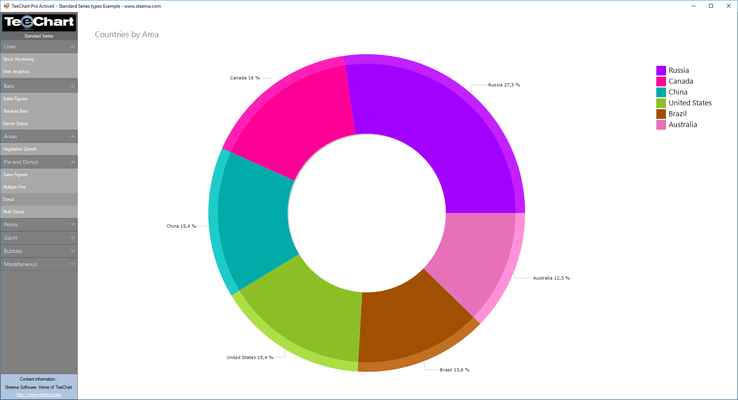
Donut Pie Chart
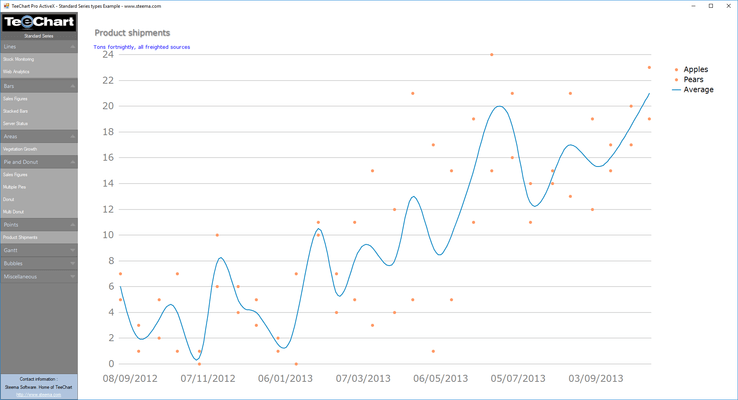
Point and Line Chart
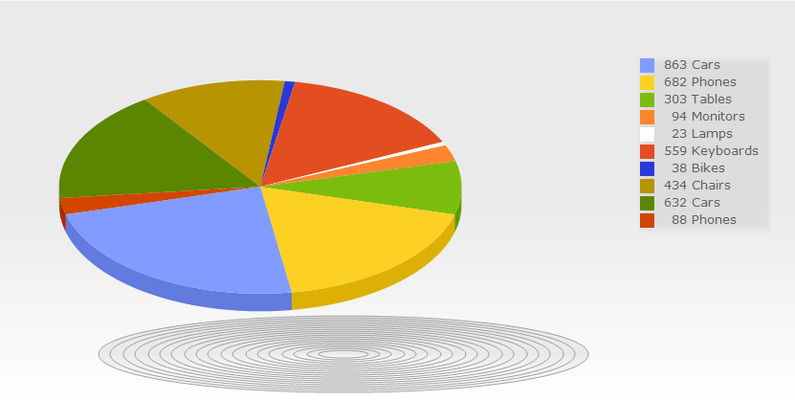
Multi Pies Chart
Scroller Pager
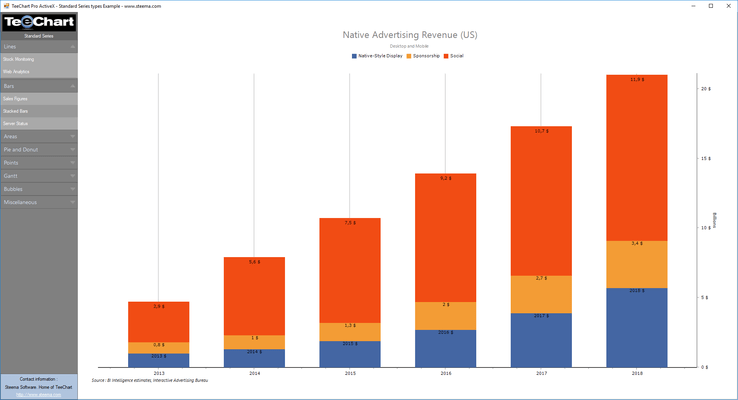
Stacked Bar Chart
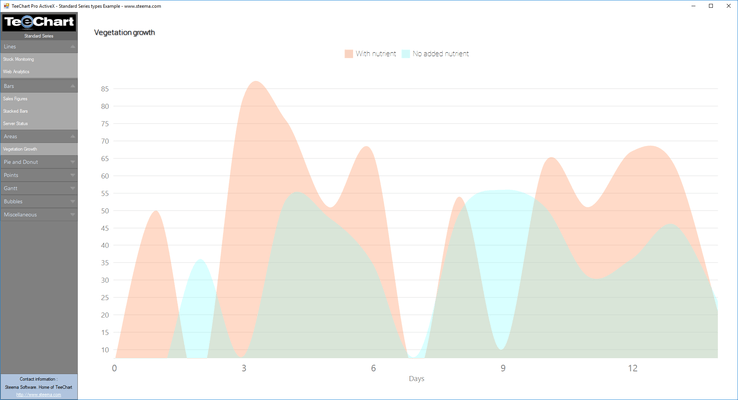
Area Chart
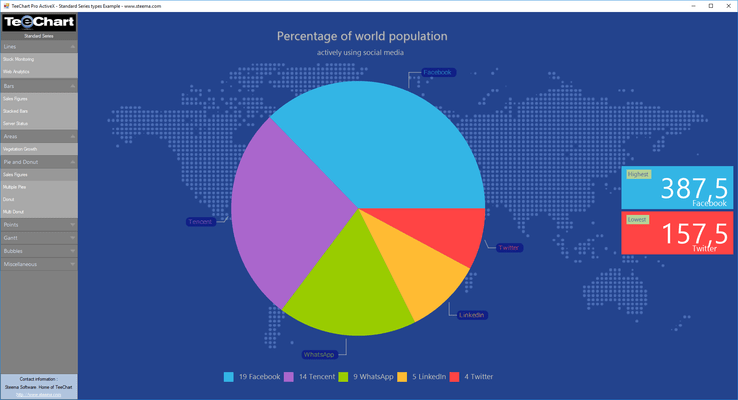
Pie Chart
Line Chart
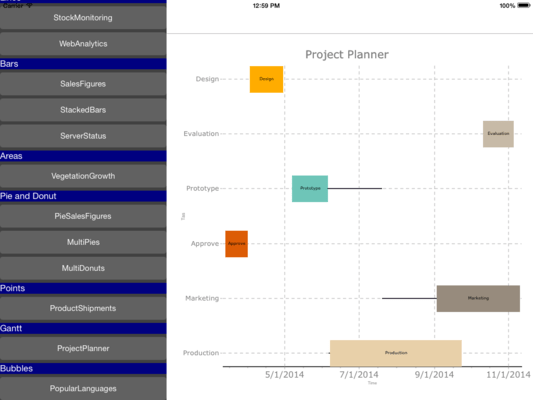
Project Planner
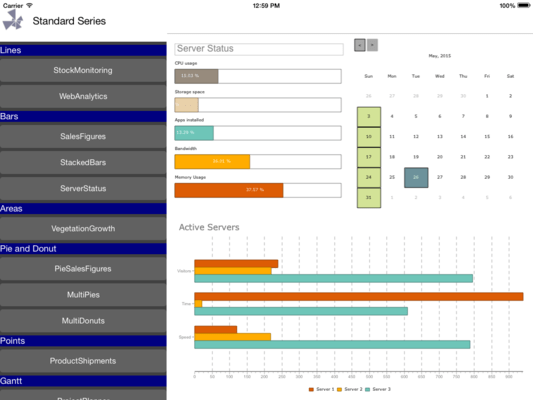
Server Status Monitoring
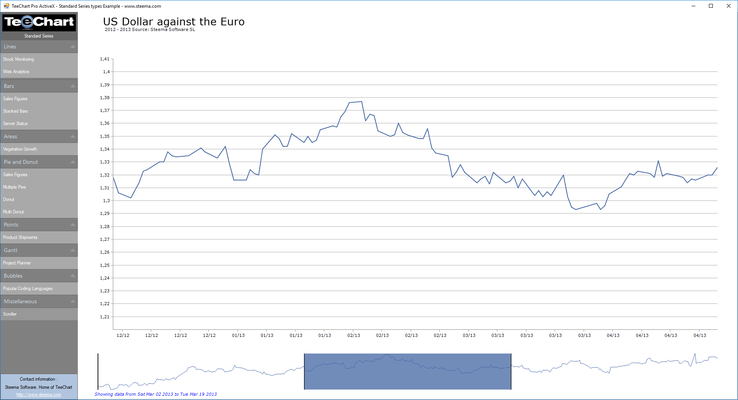
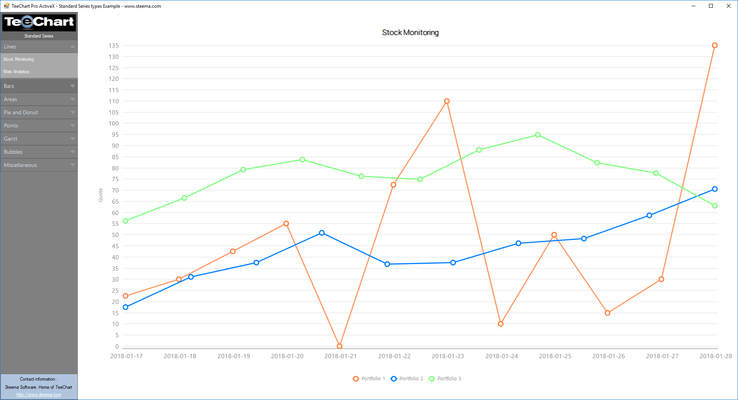
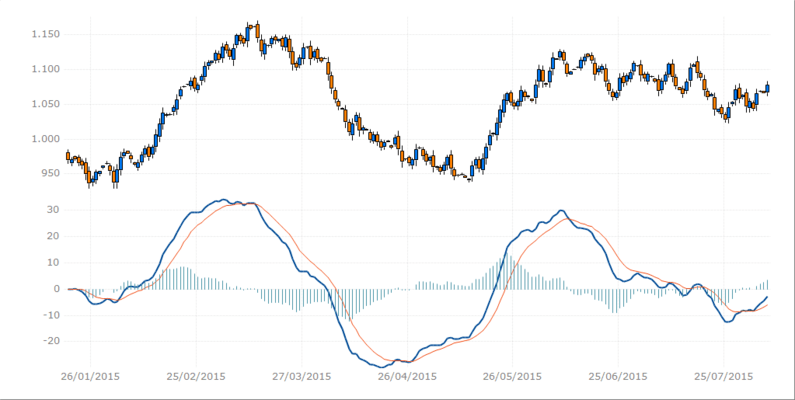
Stock Monitoring
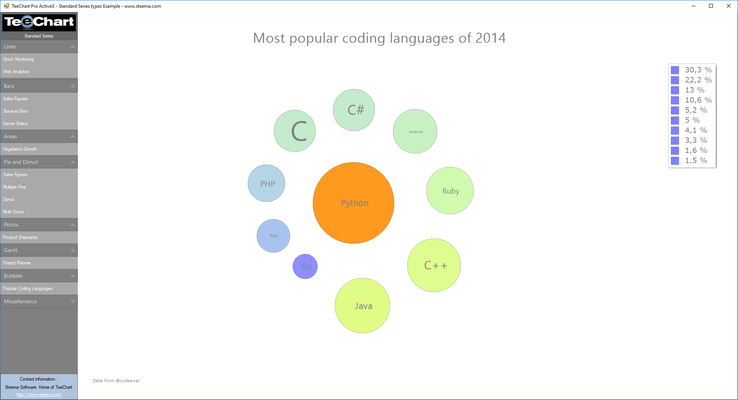
Bubbles Chart
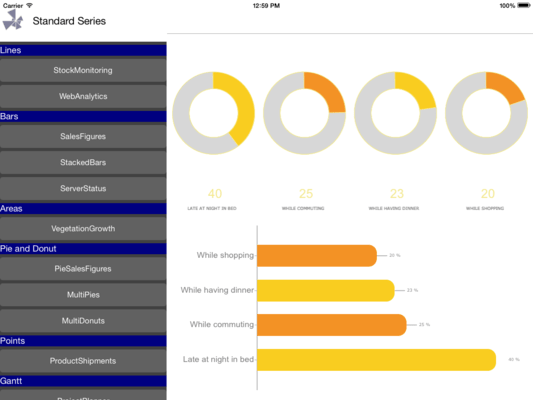
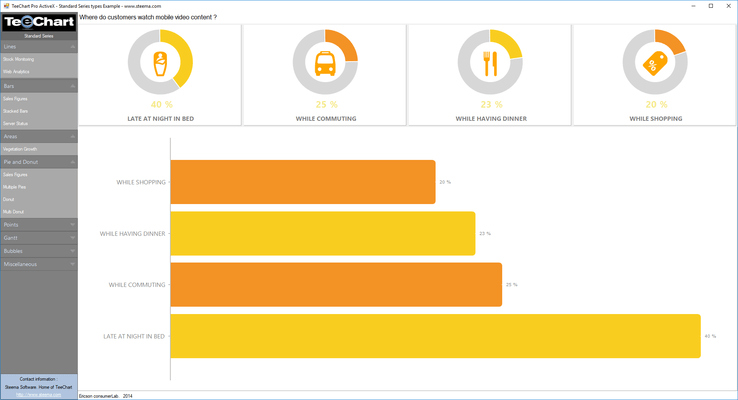
InfoGraphic
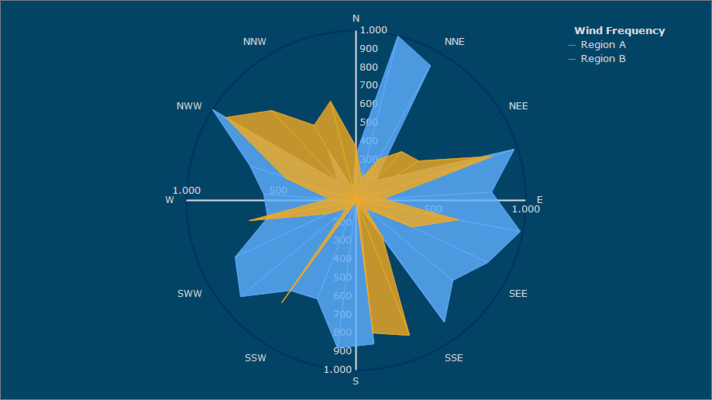
Wind-Rose Chart
DataGrid Chart tool
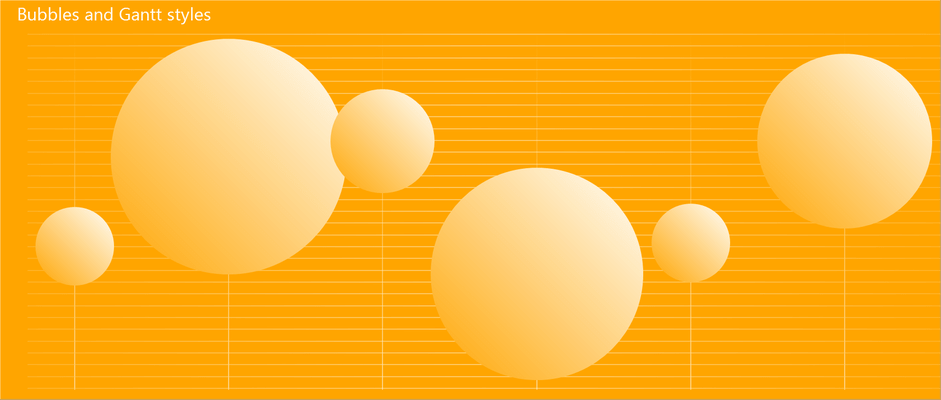
Bubbles and Gantt Styles
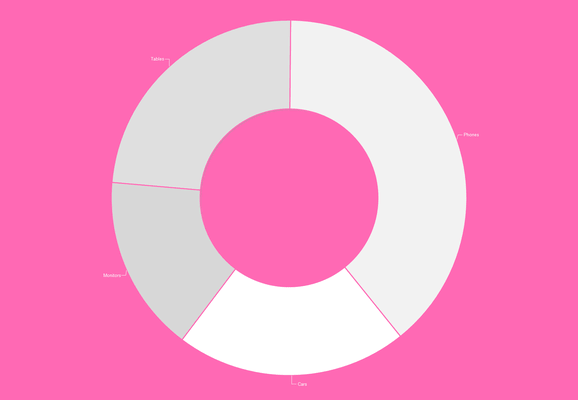
Donut Chart
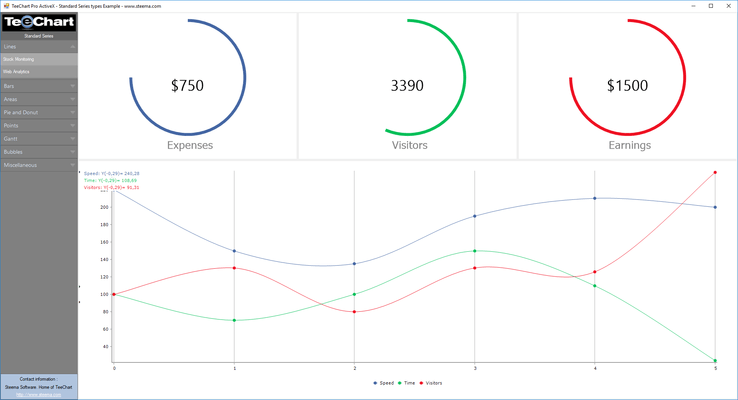
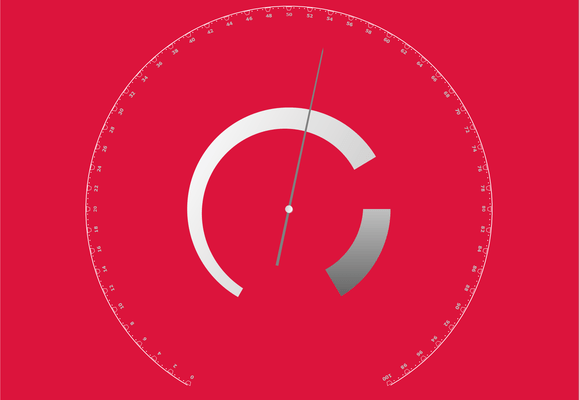
Circular Gauge
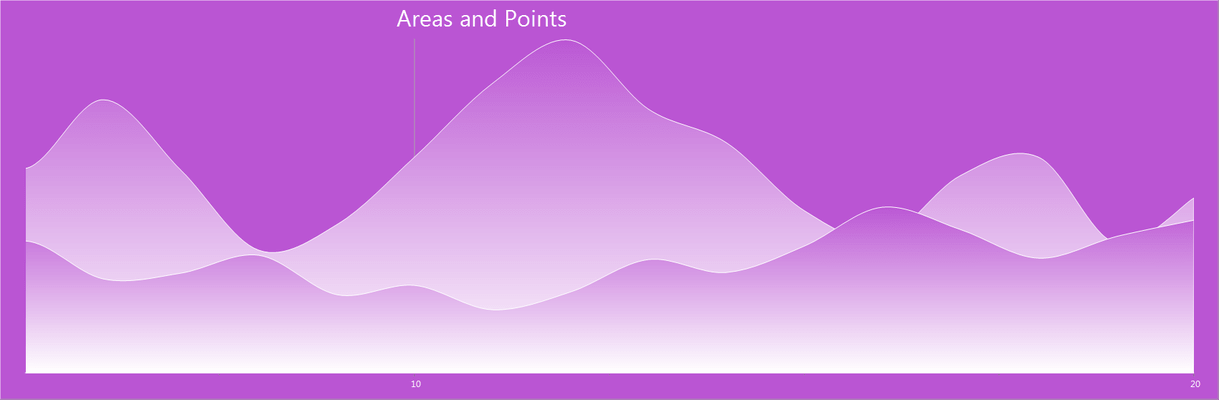
Areas and Points Chart
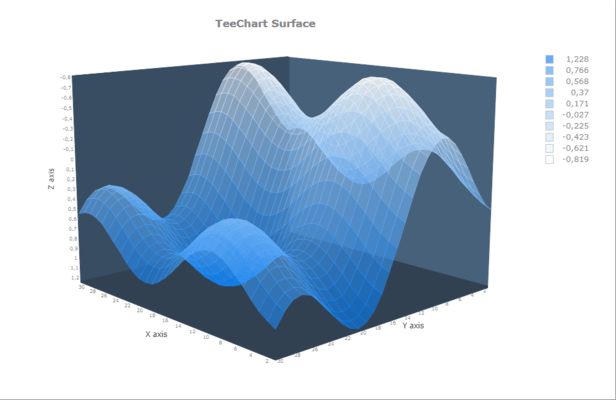
Surface Chart
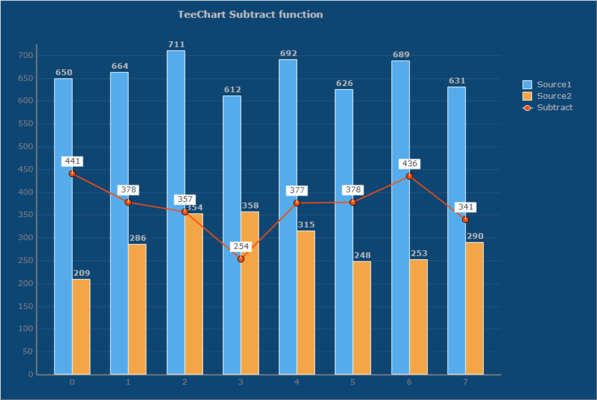
Subtract function Chart
Financial A.D.X Indicator
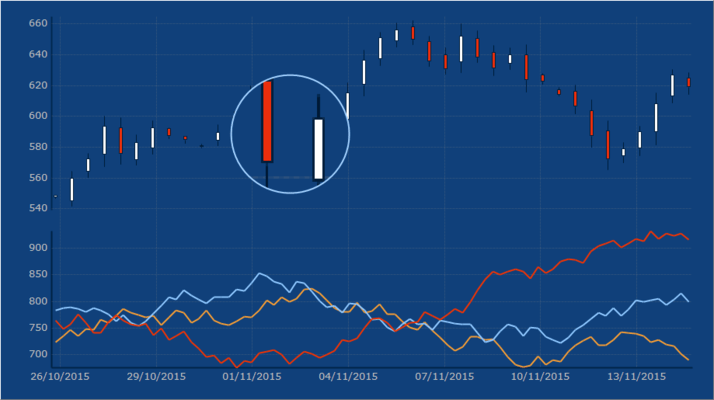
Financial MACD Chart
TeeChart for ActiveX in VB
TeeChart for ActiveX in VC++
TeeChart for ActiveX in C#
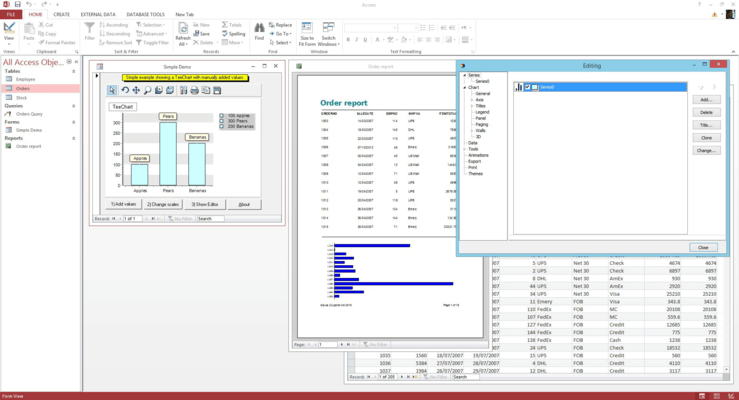
TeeChart for ActiveX in MS Office

TeeChart Pro ActiveX - IClockGaugeSeries