TeeChart
以下是 "TeeChart for .NET Enterprise Edition",如果您需要了解更多信息,您可以联系我们。

将图表、仪表和地图添加到您的.NET 应用程序。
TeeChart for .NET offers charting controls for a myriad of charting requirements including important vertical areas such as financial, scientific and statistical. It handles your data, creating informative and attractive charts, seamlessly across a variety of platforms including Windows Forms, WPF, ASP.NET with HTML5/Javascript rendering and Universal Windows Platform (UWP). TeeChart for .NET C# code may be reused with Steema's mobile TeeChart products for Xamarin to reach Windows Phone, Android and iOS directly or via Xamarin's Forms PCL platform. TeeChart for .NET Enterprise includes TeeChart Pro for .NET, TeeChart Pro for .Xamarin.iOS, TeeChart Pro for .Xamarin.Android, TeeChart Pro for .Xamarin.Forms and TeeChart JavaScript sourcecode.
TeeChart Charting Components for NET offer great generic Charting controls for a myriad of charting requirements, targeting important vertical areas such as the financial, scientific and statistical worlds.
TeeChart offers fully interactive Charts, Maps and Gauges for .NET; desktop, mobile & the browser page.
Flexible data visualization
The TeeChart Chart Component for .NET handles your data, creating informative and attractive charts, seamlessly across a variety of platforms including: Windows Forms, WPF, ASP.NET with HTML5/Javascript rendering and Universal Windows Platform (UWP).
TeeChart for .NET C# code may be reused with Steema's mobile TeeChart products for Xamarin to reach Windows Phone, Android and iOS directly or via Xamarin's Forms PCL platform.
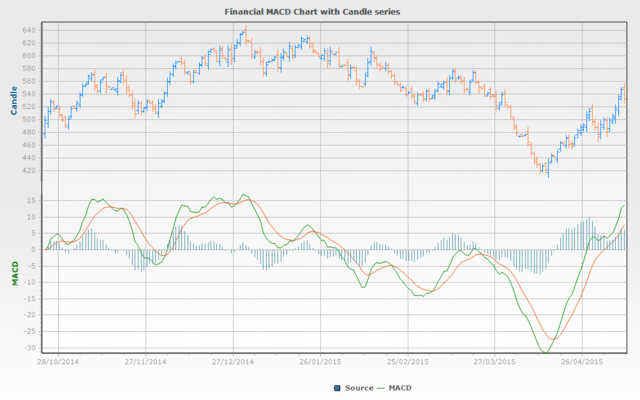
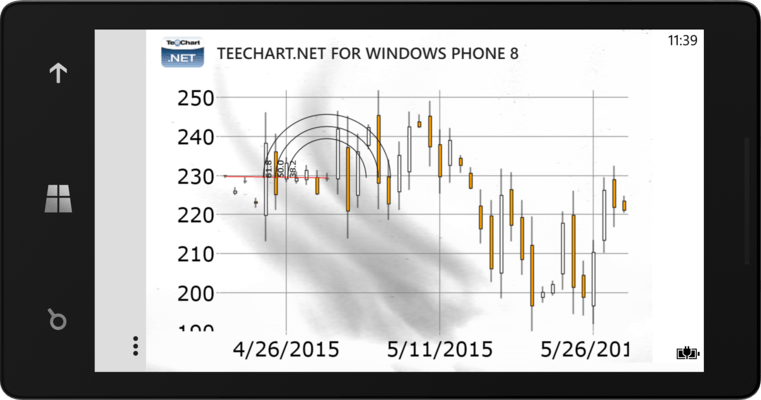
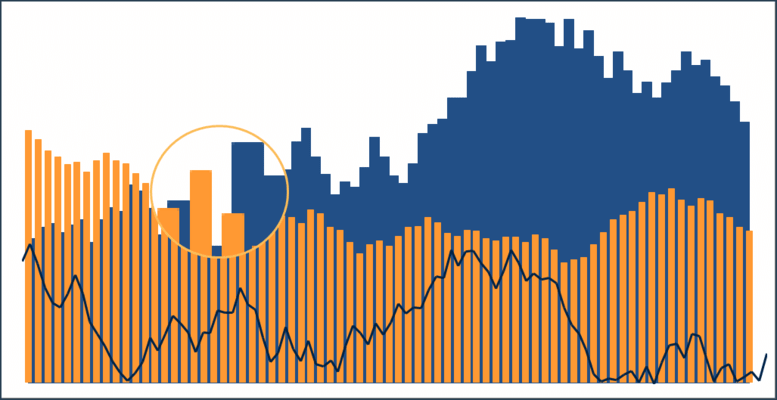
Many indicators designed to track financial data
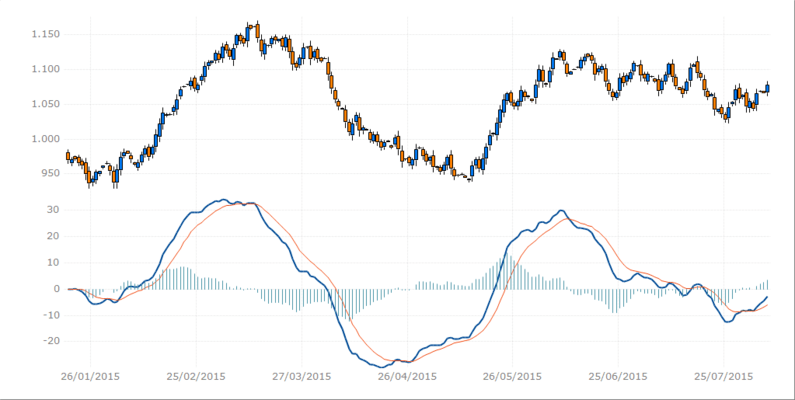
TeeChart Pro is packed with functionality to produce high-class financial charting applications. Functions and indicators include: Open-High-Low-Close Series, Candle, Volume and MACD, ADX, Stochastic, Bollinger, Momentum, Moving Average and many more statistical functions.
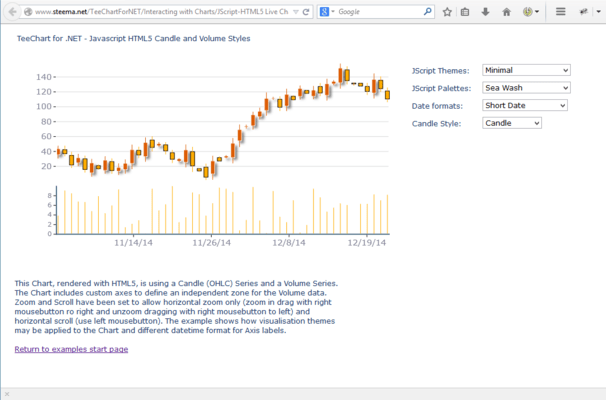
WebForm charts rendering as HTML5 Javascript
TeeChart.NET’s WebChart component may be placed on the WebForm panel for full in-place WYSIWYG editing. Charts may be streamed directly to the browser in WebForm or MVC to avoid maintenance of temporary files or you can render your server-side WebForm projects as client-side HTML5 Javascript, live in the browser itself. The charts are fully interactive and may be configured via C# code back end at the server or directly on the webpage as browser-side Javascript.
WebForm charts rendering as HTML5 Javascript charts.
Many indicators designed to track financial data.

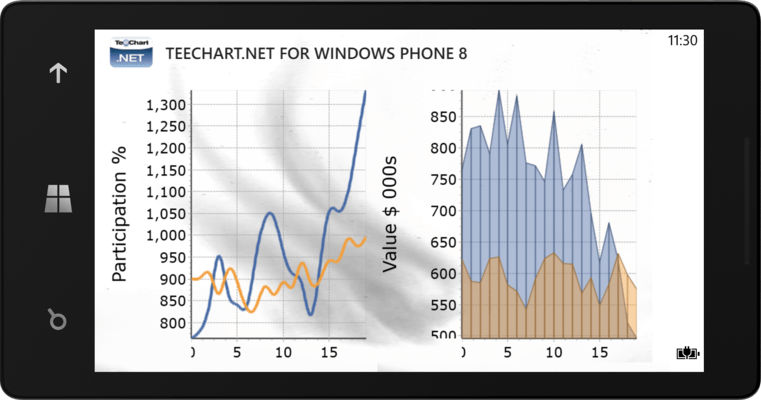
Use multiple axes on charts.
WPF, Silverlight, ASP.NET, Flash, CF, Winforms, Reporting Services
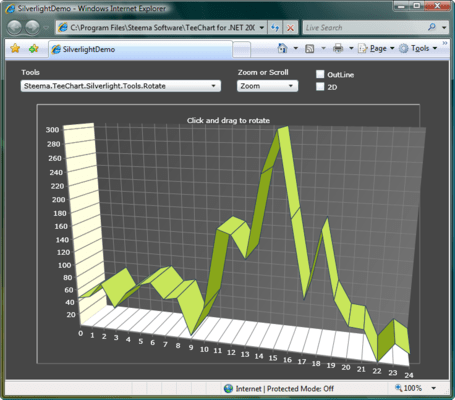
Chart Series Types
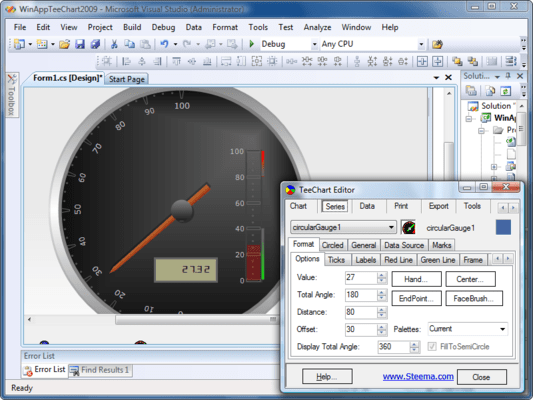
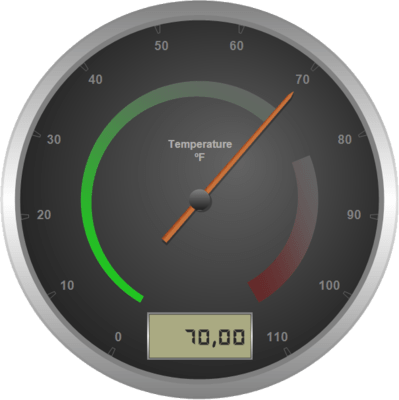
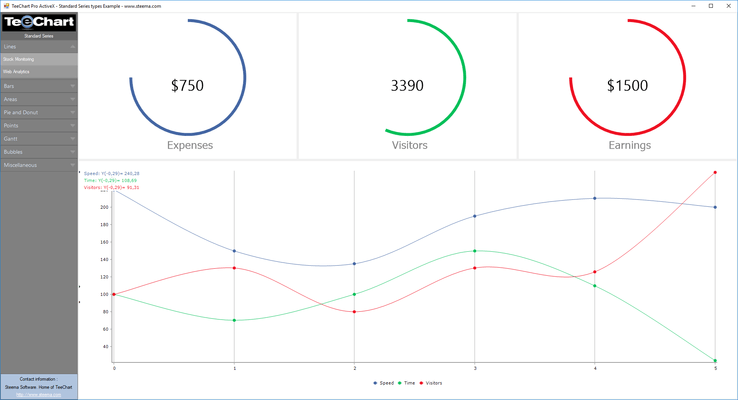
Gauges
Design Time integrated Chart and Series editor
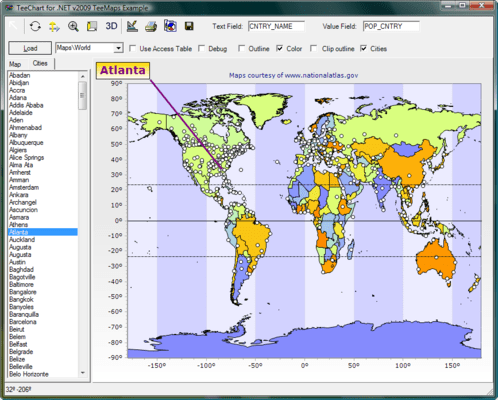
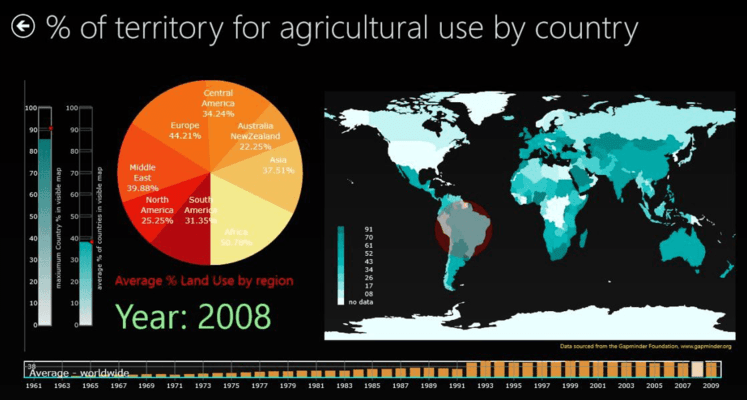
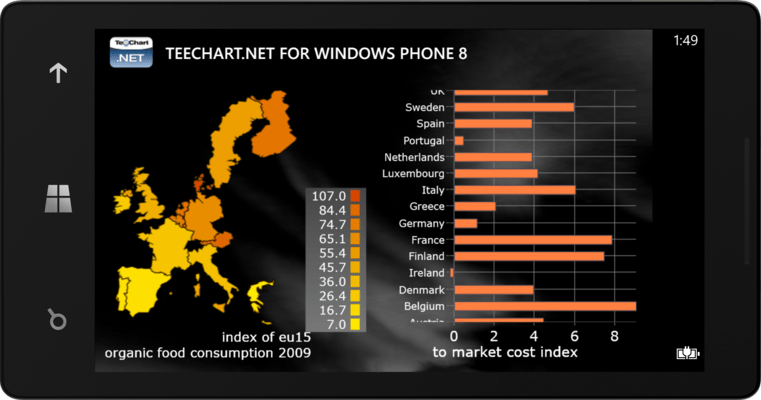
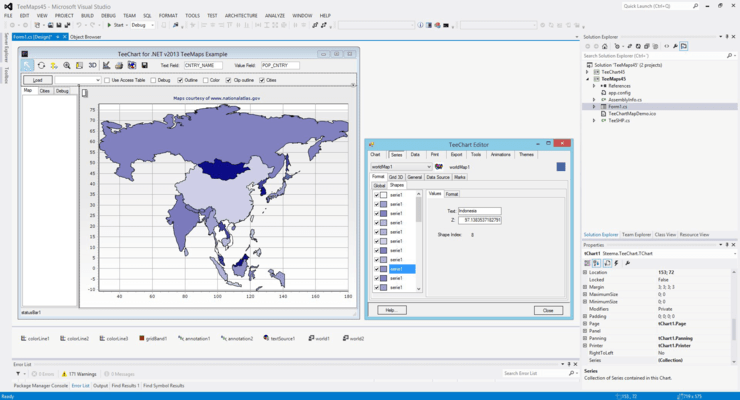
GIS Mapping
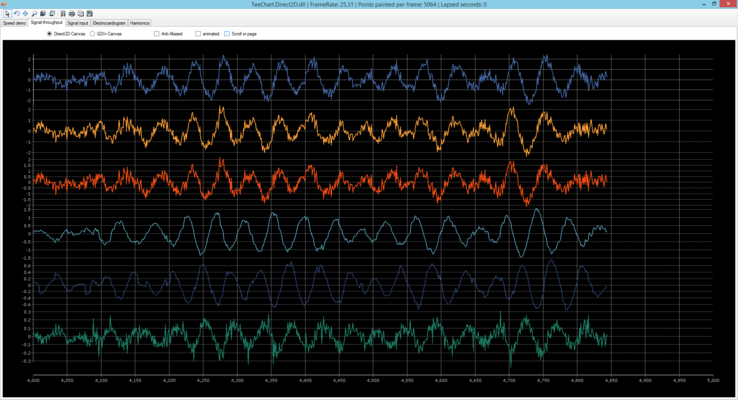
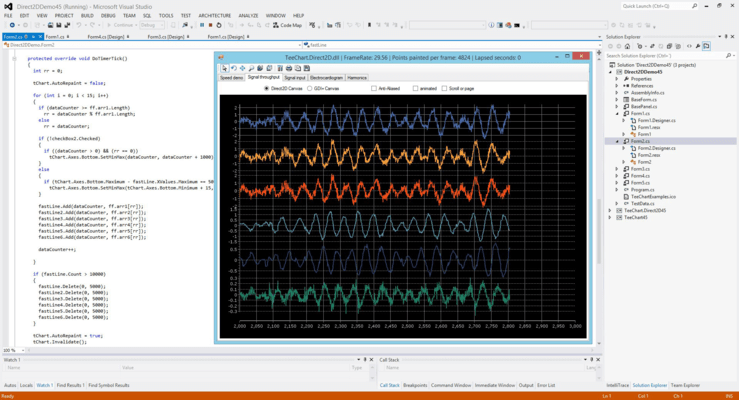
Signal Throughput
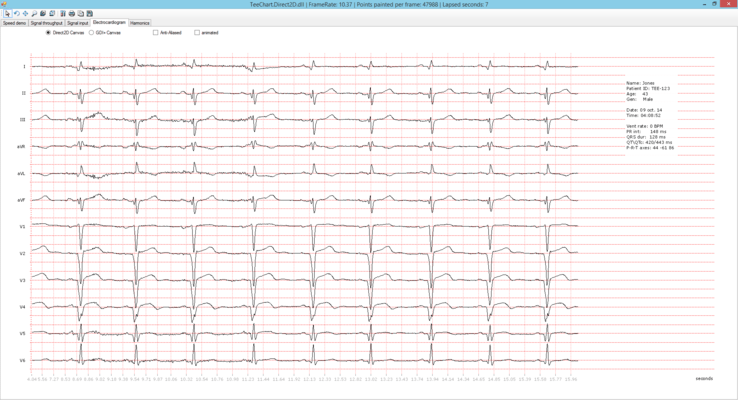
Electrocardiogram
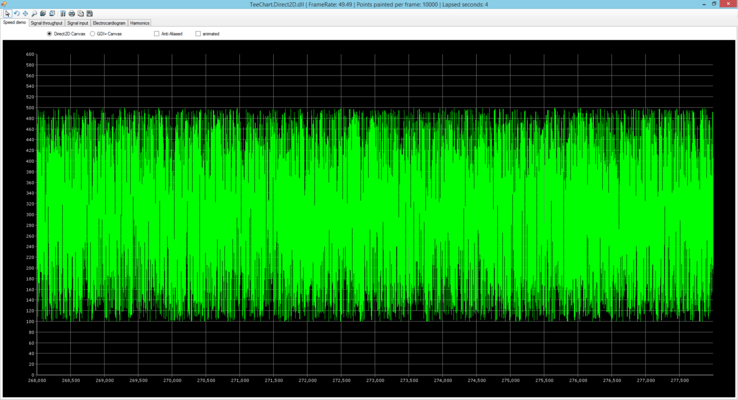
High Speed
Combination Gauges
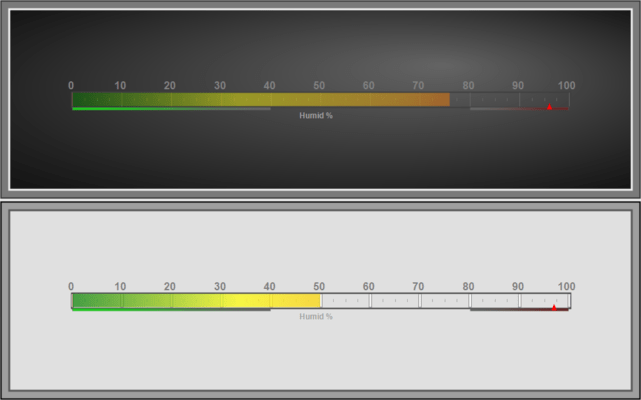
Linear Gauge
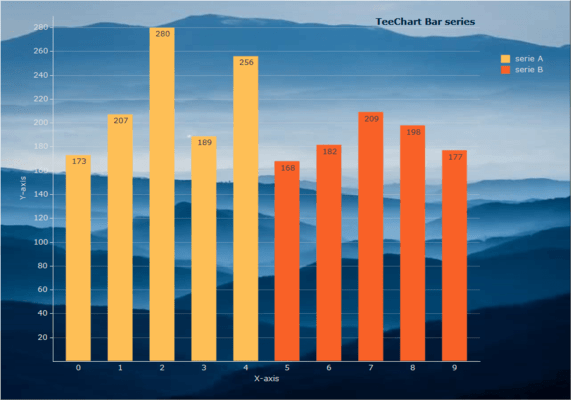
Background Chart
Financial MACD Chart
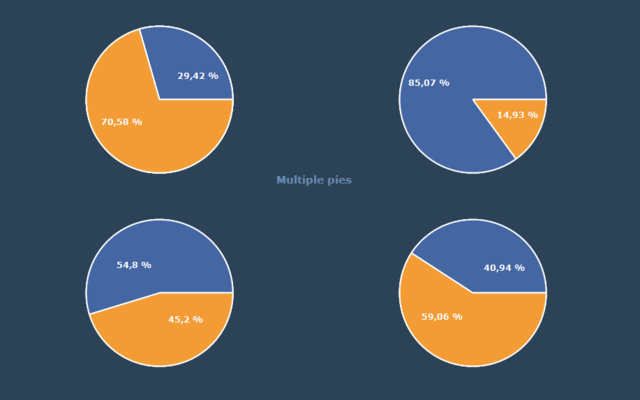
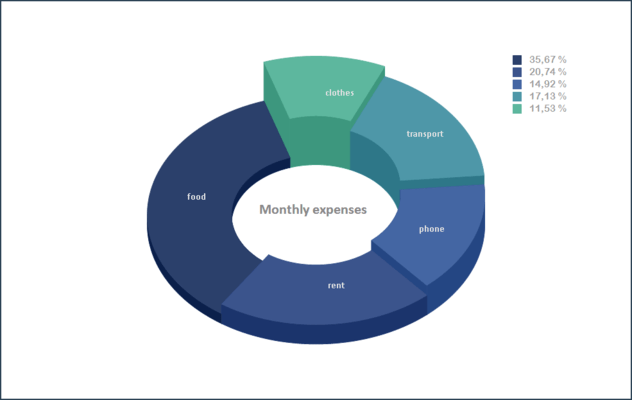
Multiple Pies Chart
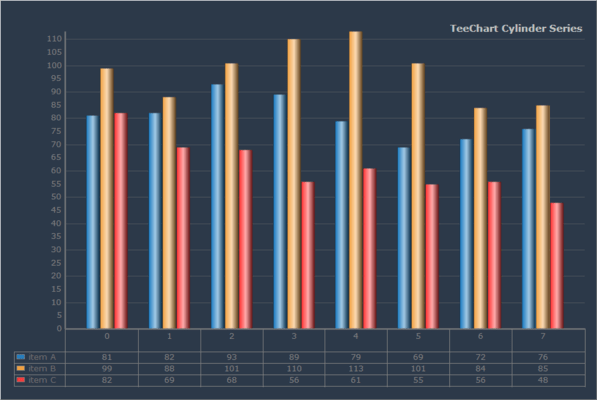
Cylinder Chart
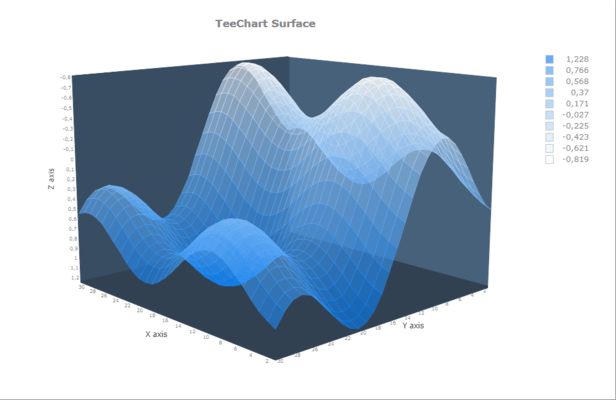
Surface Chart
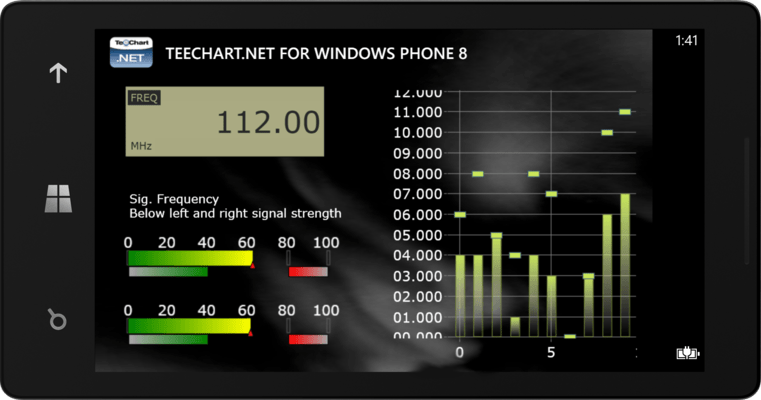
Windows Dashboard
Technical
Fibonacci Arcs
Geographic
Statistics
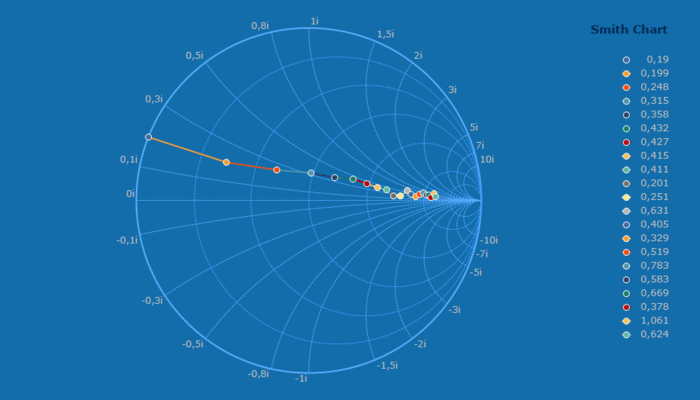
Smith Chart
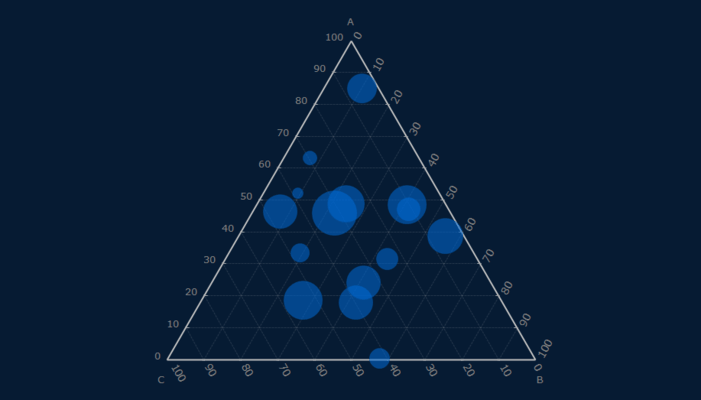
Ternary Chart
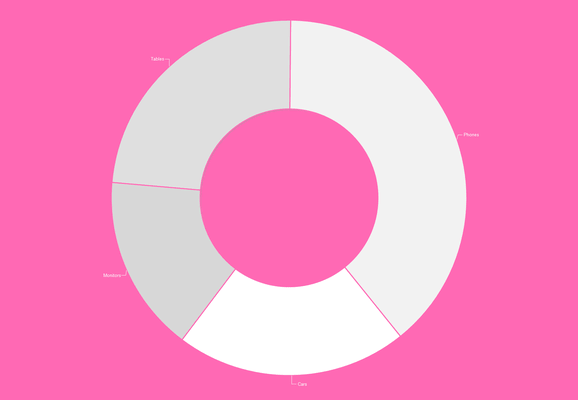
Donut Chart
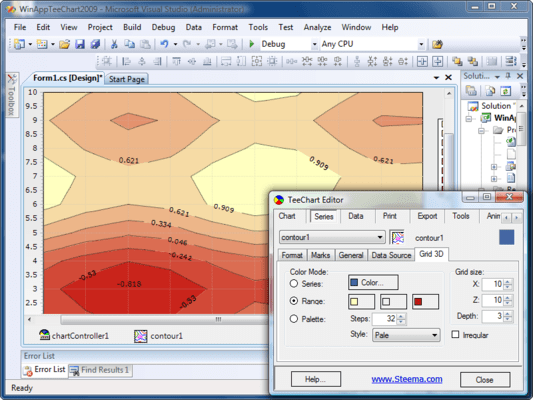
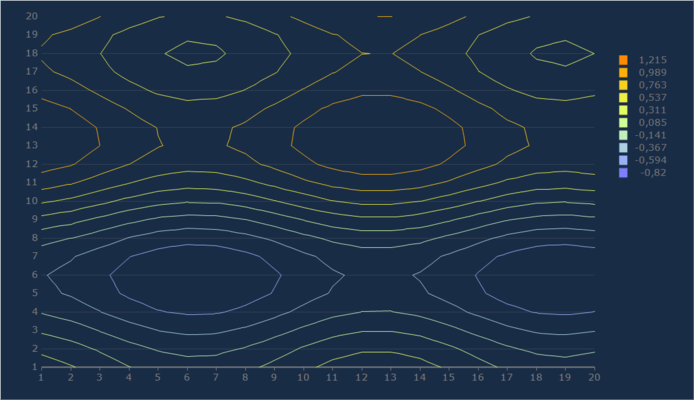
Contour Chart
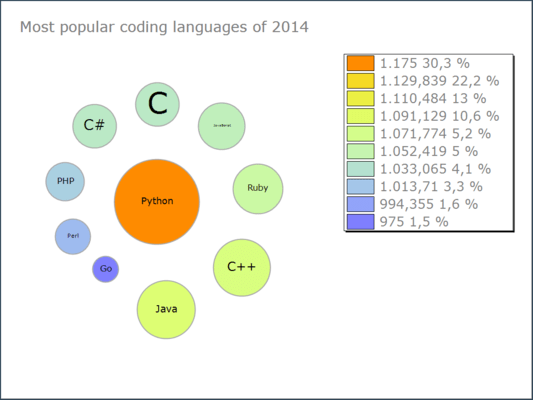
Bubble Cloud
MultiChart

Weather
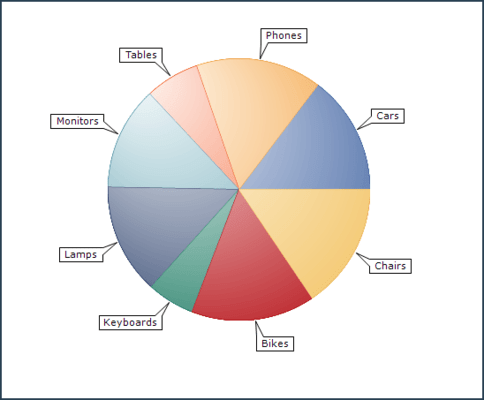
ASPNET Pie Chart
ASPNET MVC Interpolation Chart
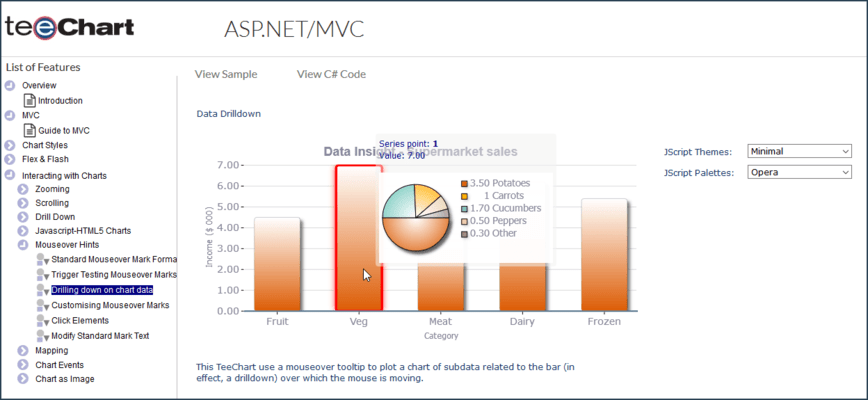
ASPNET Chart Drilldown
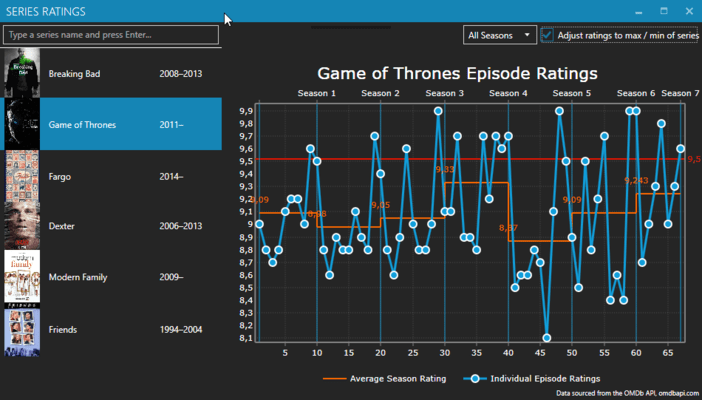
Series ratings Chart
InfoGraphic
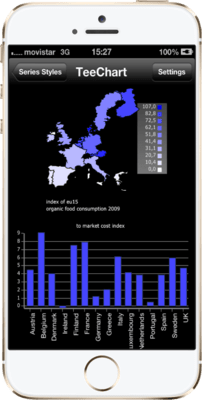
Map Chart
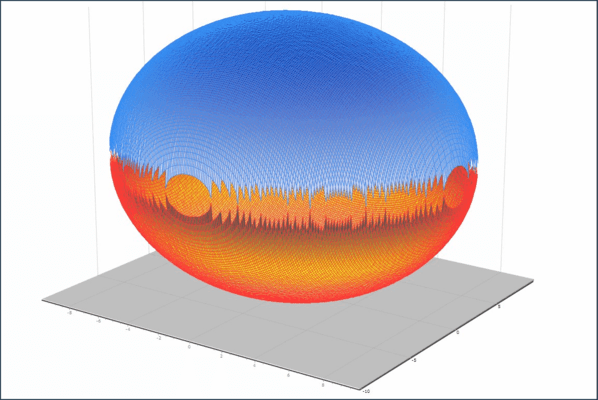
3D Surface Chart
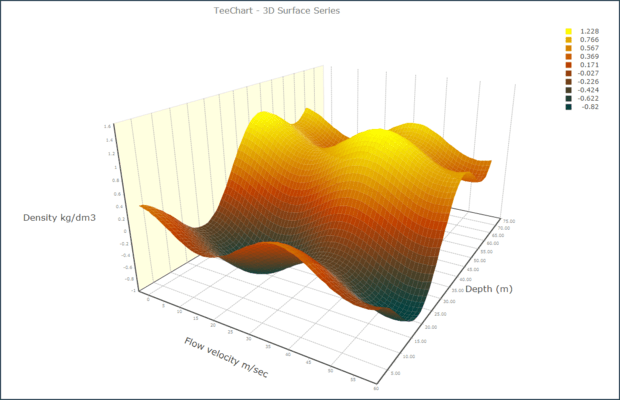
3D Surface Chart
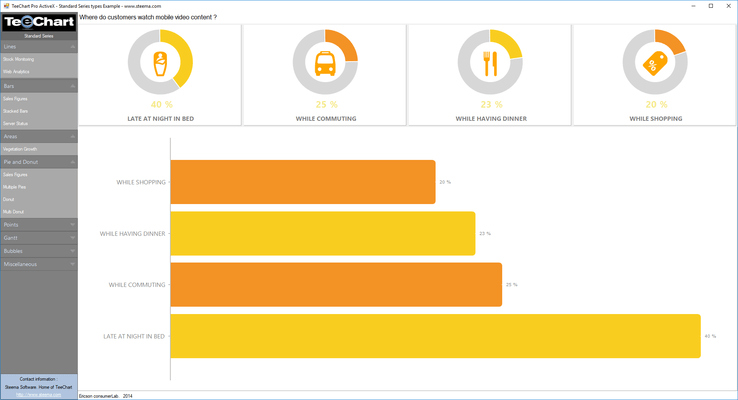
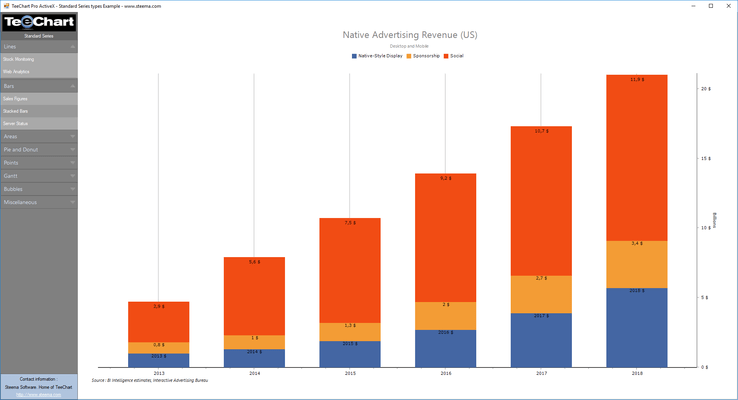
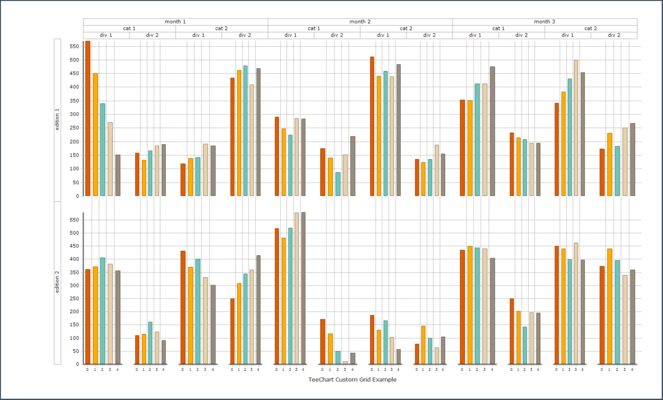
Stacked Bar Chart
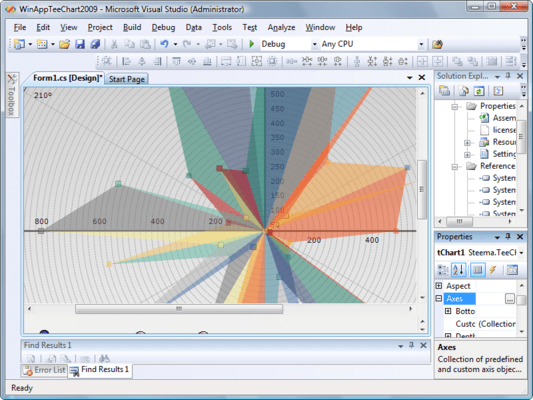
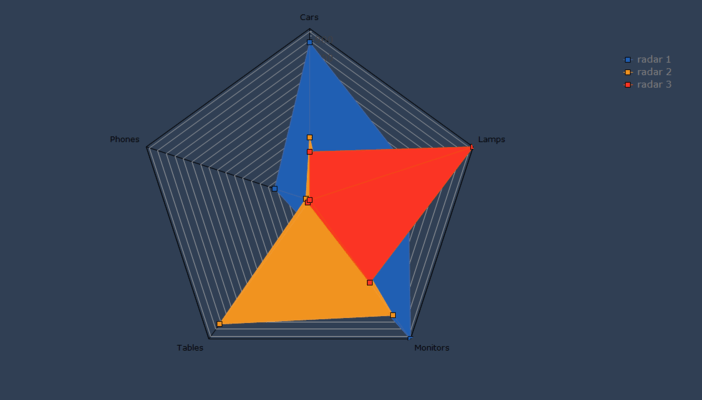
Radar Chart
Business Intelligence (BI)
.png)
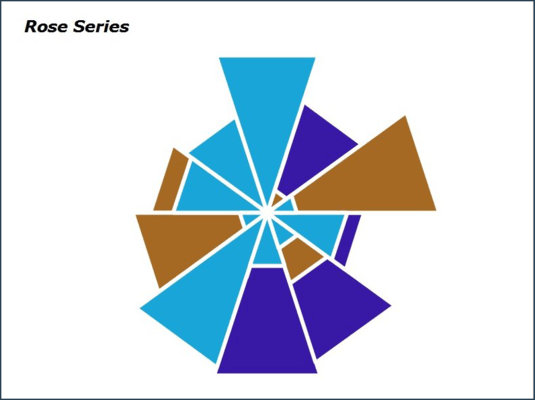
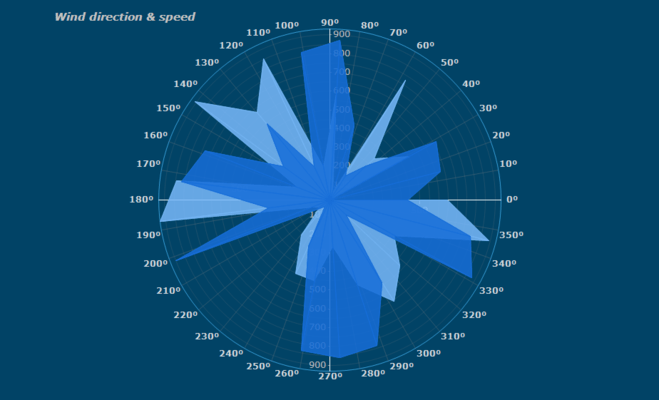
Polar Chart
Stepped Pie
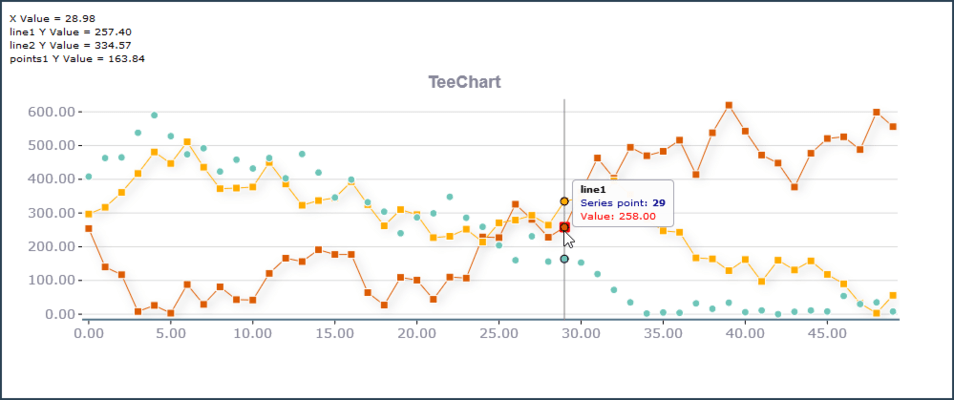
Line Chart
Magnify Chart Tool
Multiple Axes
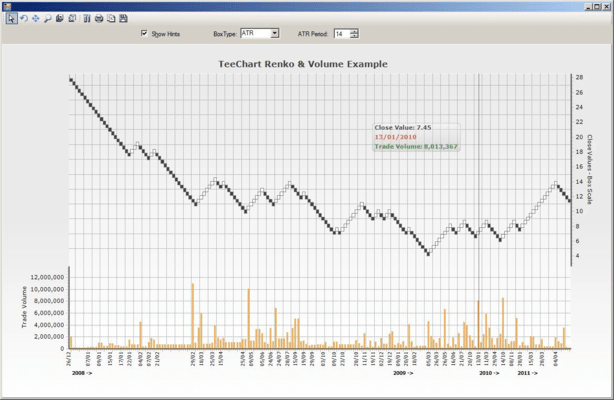
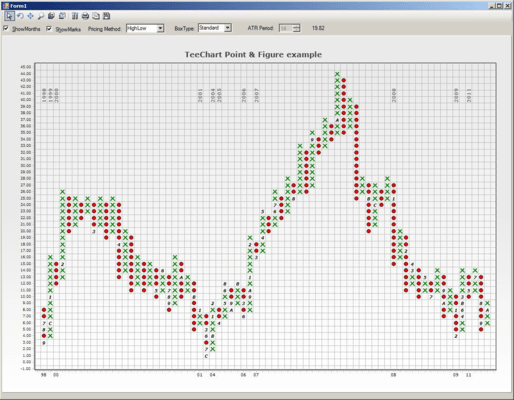
Point and Figure Function

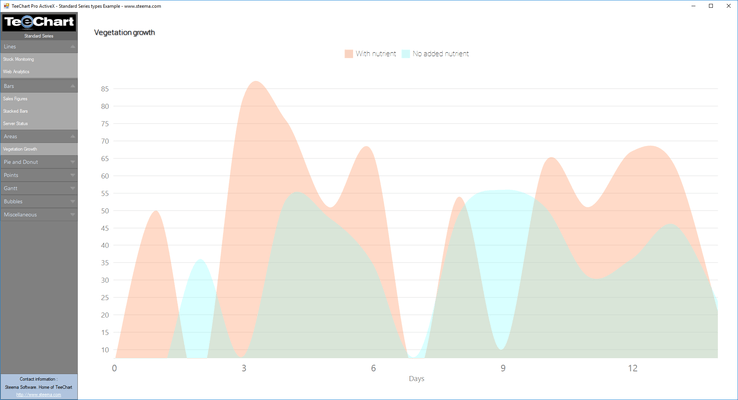
Area Chart
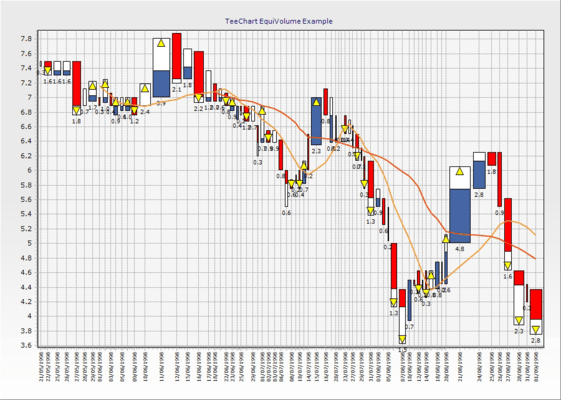
Financial EquiVolume function
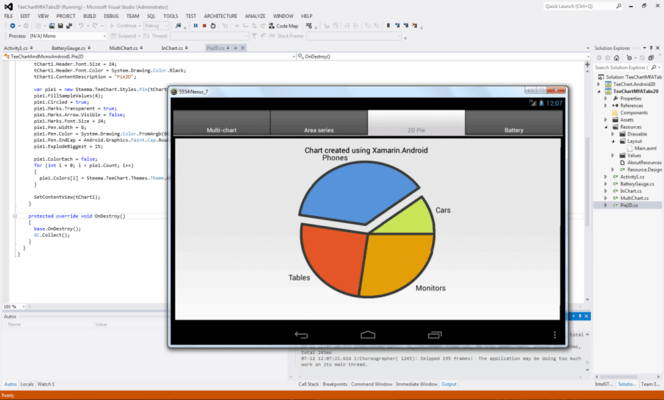
Pie Chart XamarinAndroid
Technical Analysis
Cardio VSNET
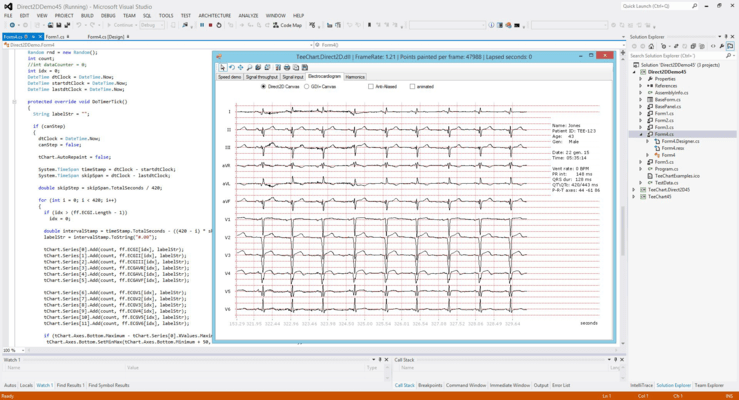
Direct2D VSNET
Maps VSNET
Financial Chart
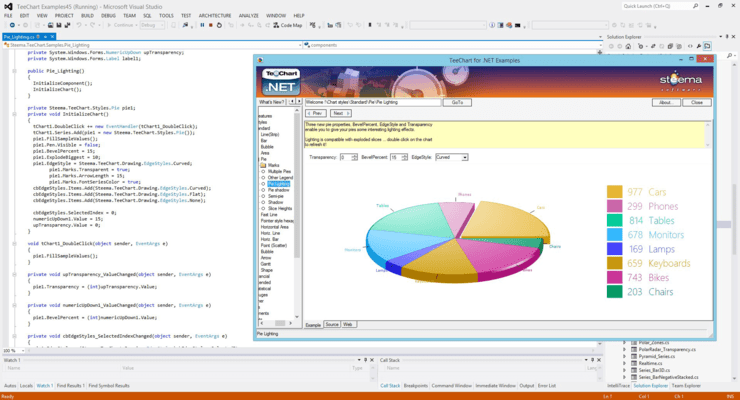
PieLight VSNET
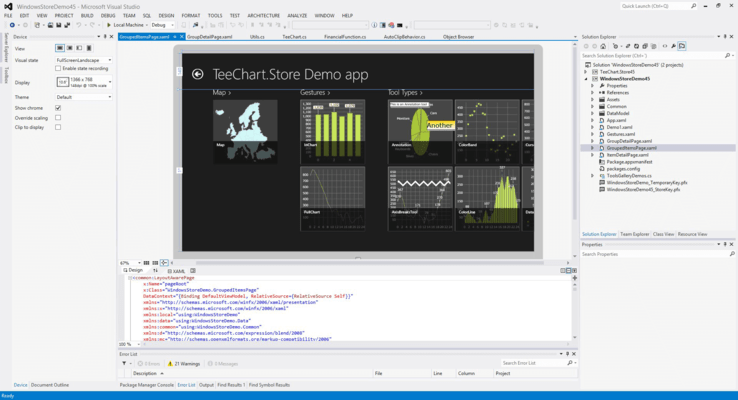
Store VSNET