TeeChart
以下是 "TeeChart for .NET Pro Edition ",如果您需要了解更多信息,您可以联系我们。
将图表、仪表和地图添加到您的.NET 应用程序。
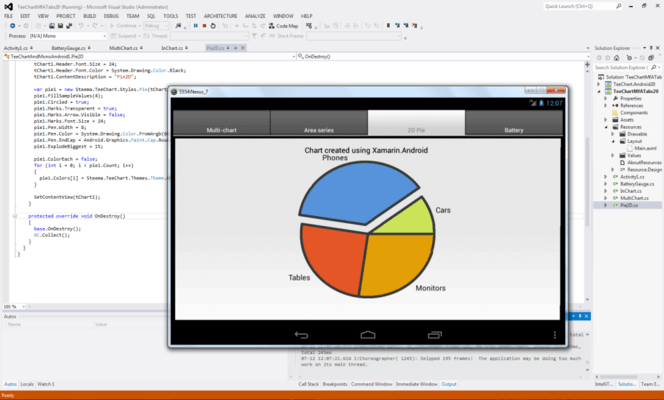
TeeChart for .NET offers charting controls for a myriad of charting requirements including important vertical areas such as financial, scientific and statistical. It handles your data, creating informative and attractive charts, seamlessly across a variety of platforms including Windows Forms, WPF, ASP.NET with HTML5/Javascript rendering and Universal Windows Platform (UWP). TeeChart for .NET C# code may be reused with Steema's mobile TeeChart products for Xamarin to reach Windows Phone, Android and iOS directly or via Xamarin's Forms PCL platform. TeeChart for .NET source code is available as an option.
Chart Types
TeeChart for .NET includes 60+ chart types and variations. From the commonly used Line, Bar, Area, Pie to those more “field-specific charts” such as Candlestick, Open-High-Low-Close, Kagi and Contour. Includes:
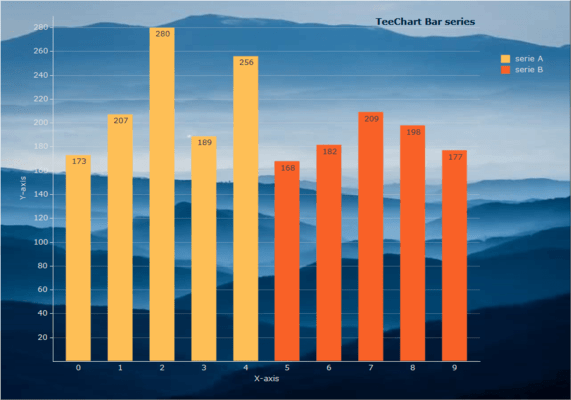
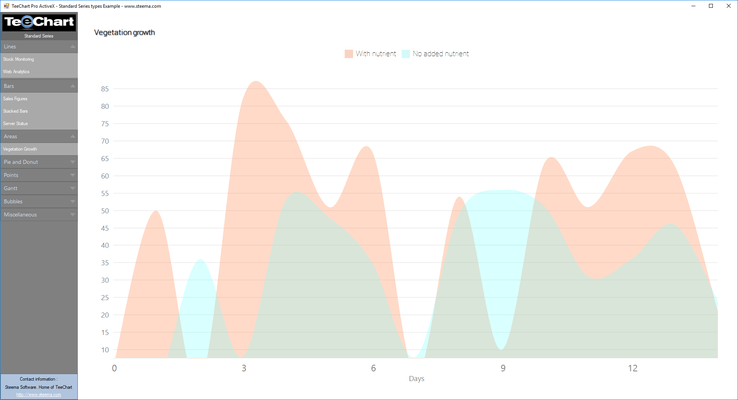
- Standard: Line (Strip), Bar, Area, Pie, Fast Line, Point (Scatter), Bubble, Arrow, Gantt, Shape, Horiz.Area, Horiz.Bar, Horiz.Line, Pointer style Hexagon.
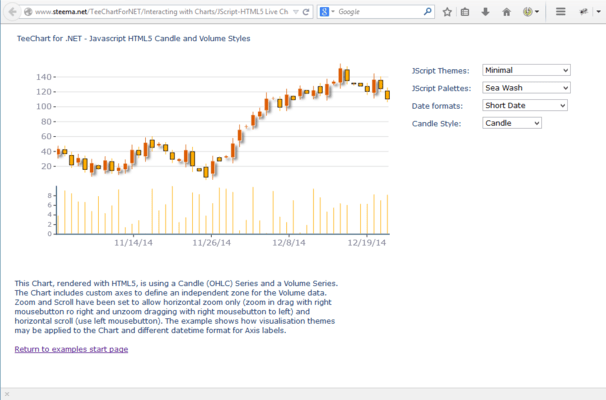
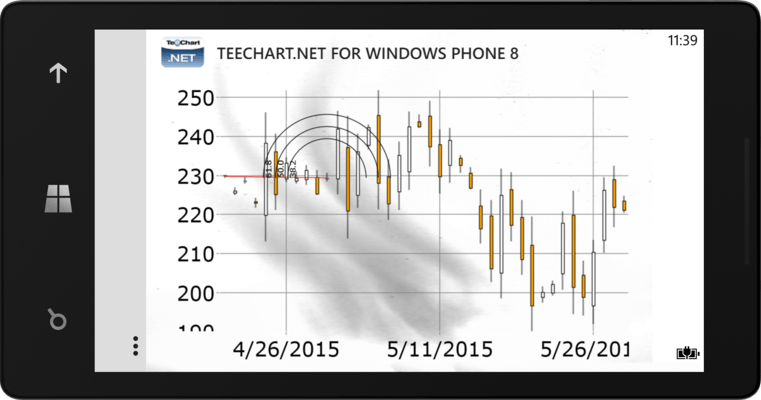
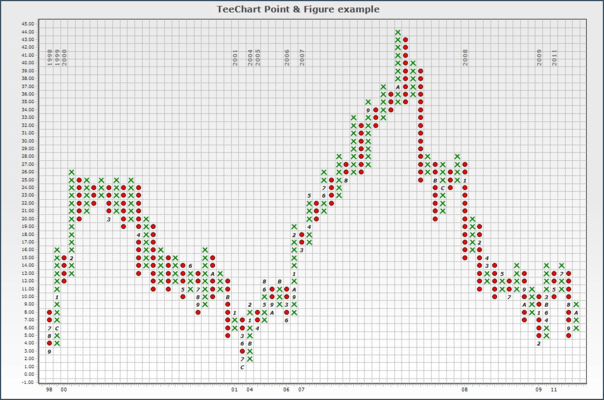
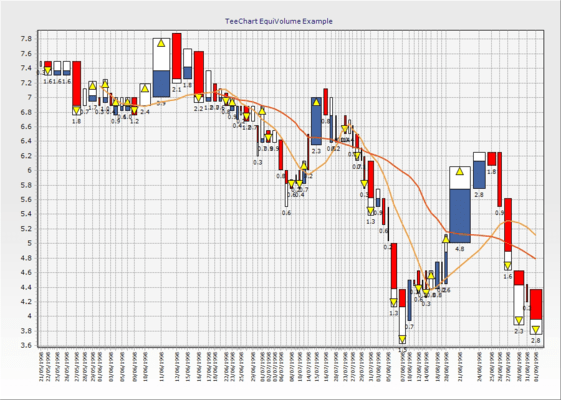
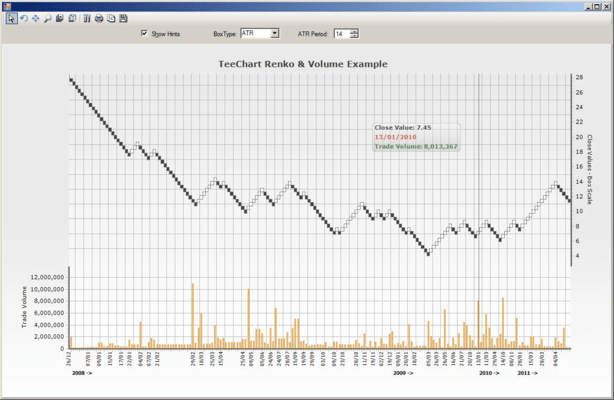
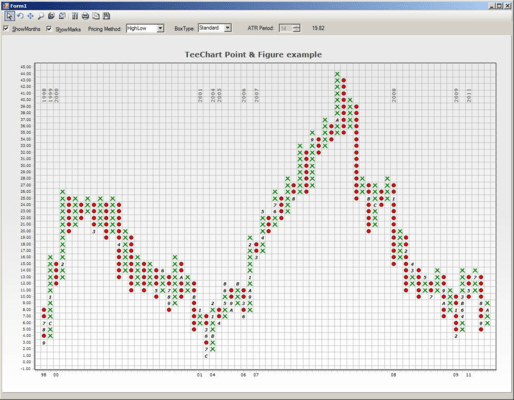
- Financial: Candle (OHLC), Darvas, Kagi, Renko, Point and Figure, Volume, EquiVolume.
- Statistical: Box-Plot, Color Grid, Error, Error Bar, Error Point, Funnel (Pipeline), HighLow, Histogram, Volume Pipe, Waterfall, Horiz. BoxPlot, Horiz. Histogram.
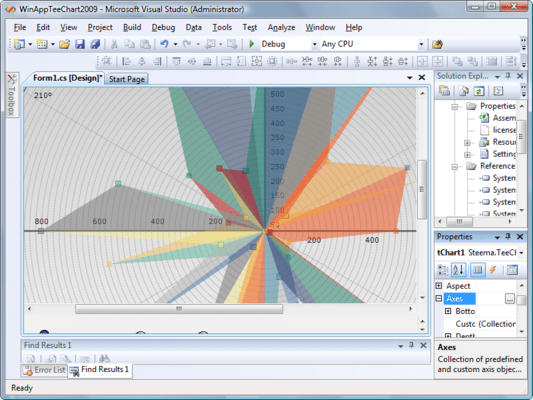
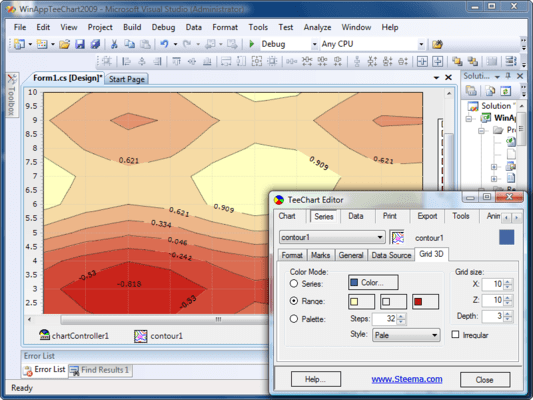
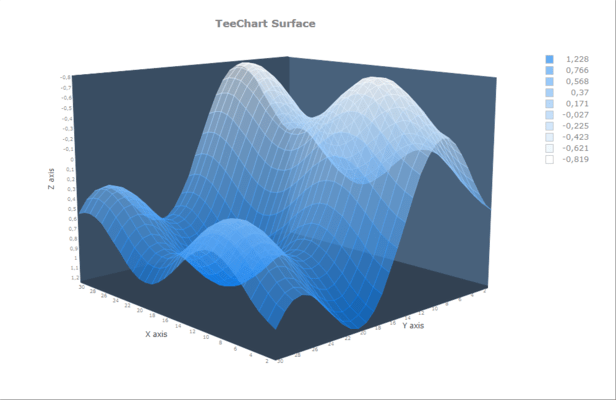
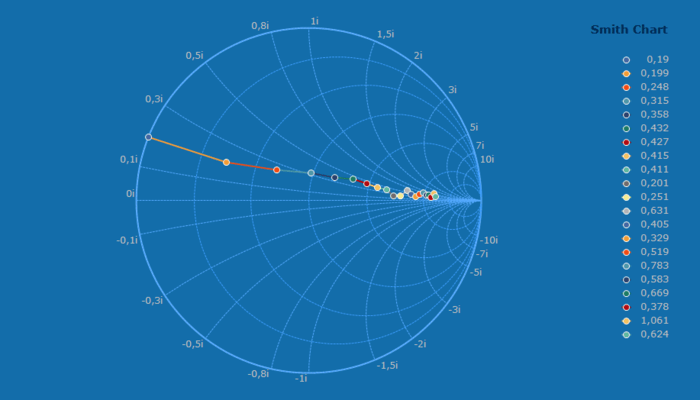
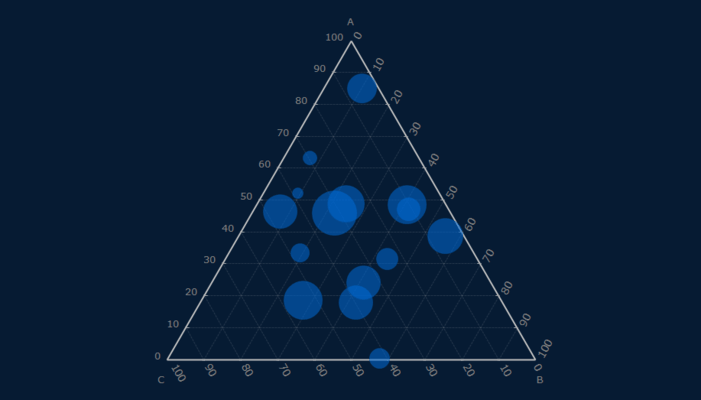
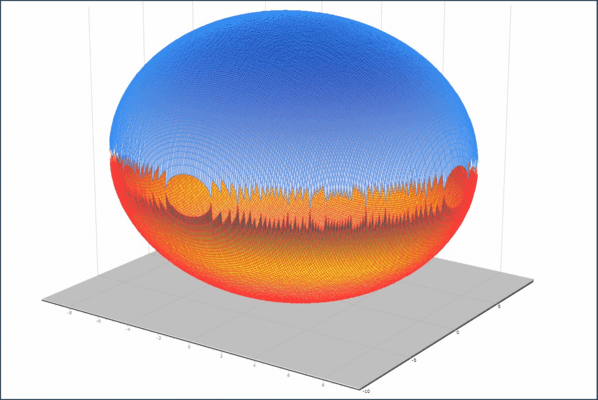
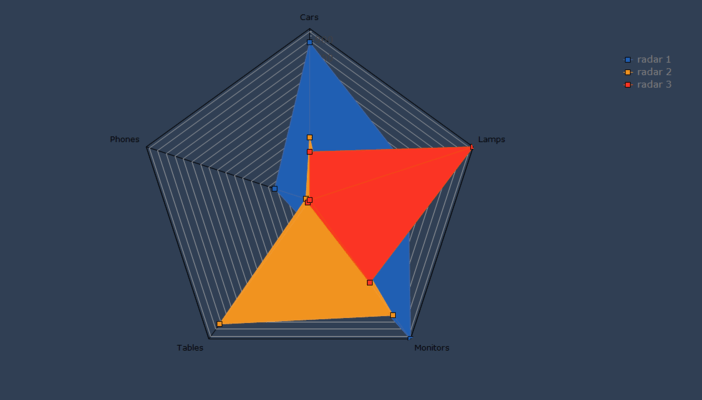
- Extended: 3D Vector, Bezier, Contour, Donut, IsoSurface, Map GIS, Organizational Chart, Polar, Polar Grid, Point 3D, Pyramid, Radar, Smith, Surface, TreeMap, Tri.Surface, Tower.
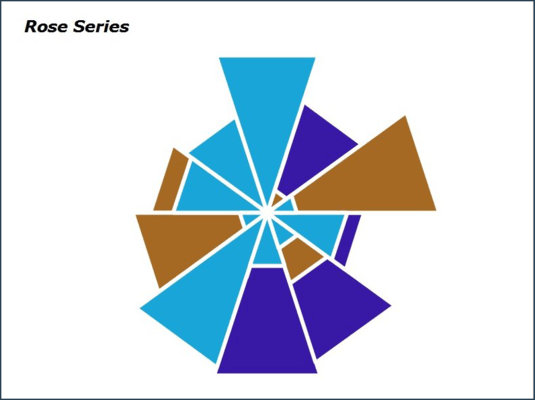
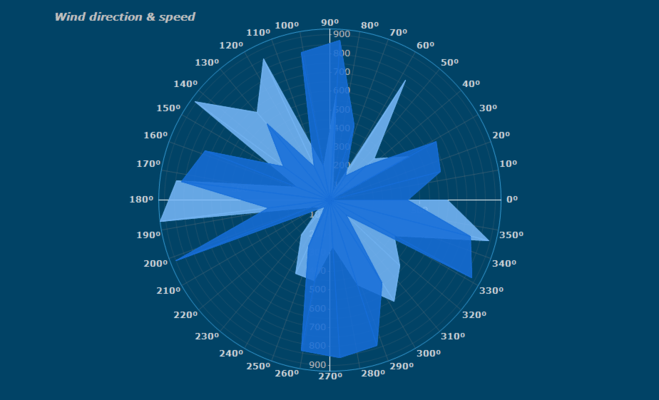
- Other: Bar 3D, Bar-Join, Calendar, Clock, Image Bar, Image Point, My Point, TagCloud, Wind-Rose, BubbleCloud.
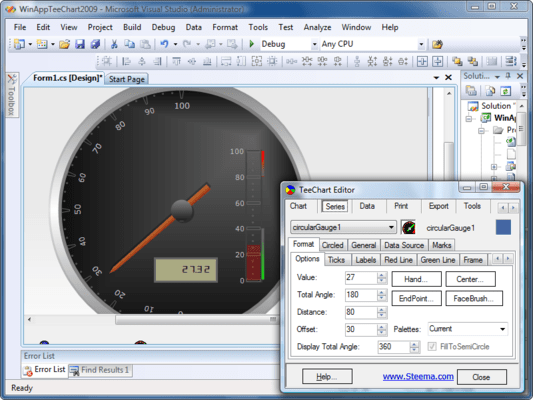
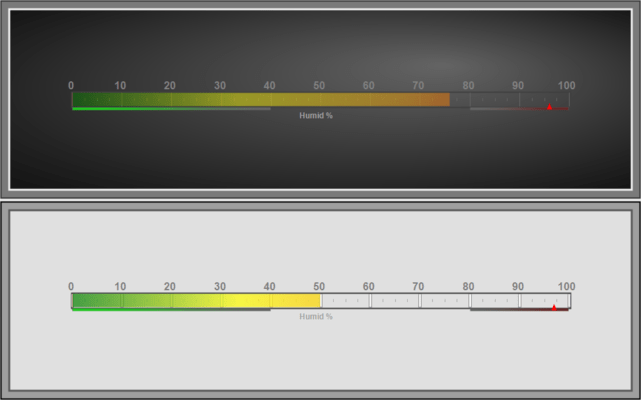
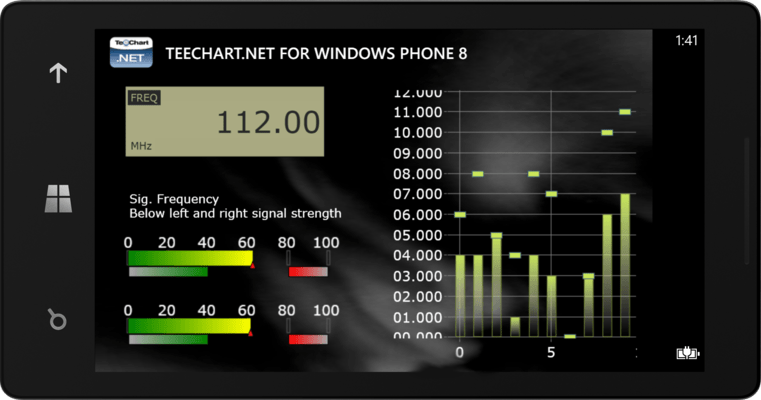
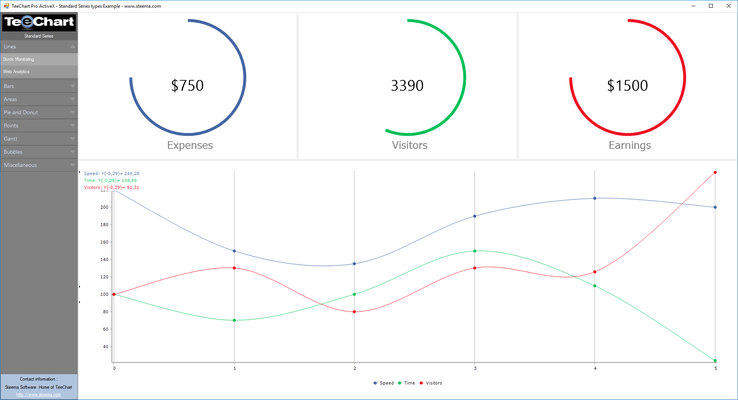
Gauges
Gauges series type and indicators (dynamic Gauges, Circular, Linear, Numeric, Knob or Combination). TeeChart's Gauges are completely configurable to give you full control of format, size, color and shape for your dashboard application.
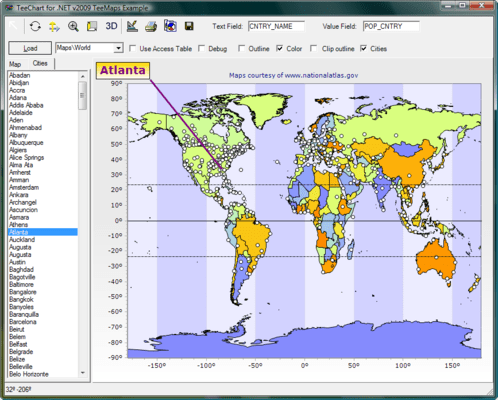
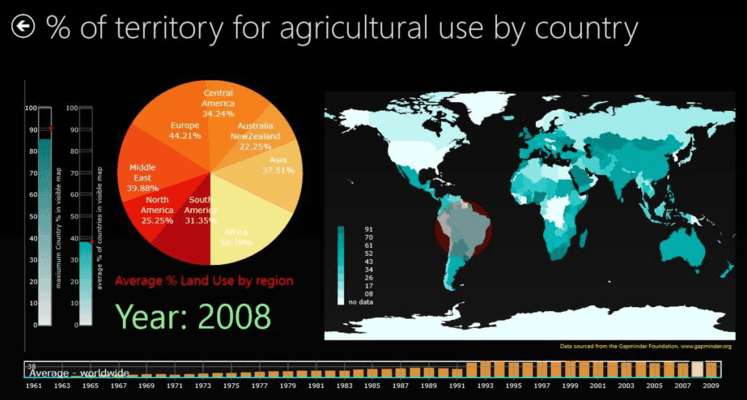
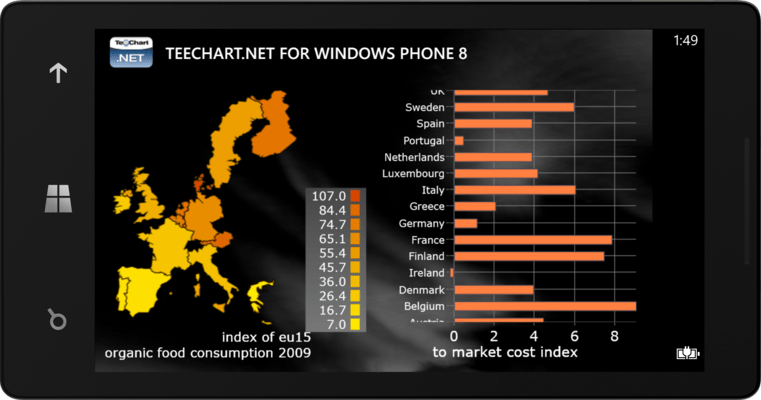
Maps
Provides library of map series with support for ESRI open standard map formats.
Functions and Indicators
50+ financial and statistical indicators including:
- Standard: Add, Subtract, Multiply, Divide, Count, Average, High, Low, Median Function, Percent Change.
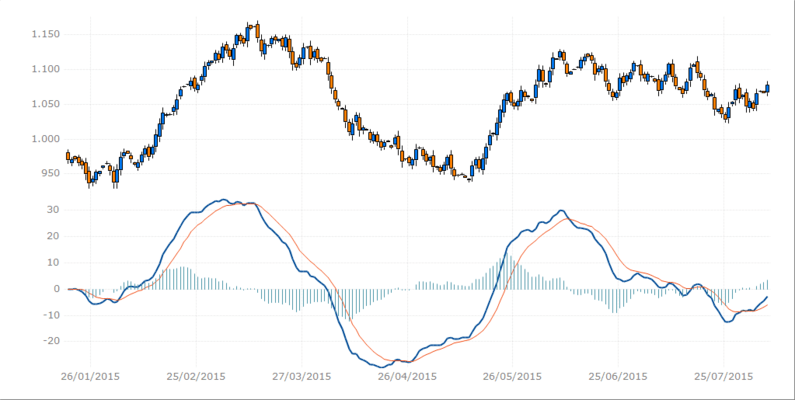
- Financial: ADX, AC, Alligator, AO, ATR, Bollinger Bands, CCI, CLV, Compression OHLC, Exp. Average, Exp. moving average, Gator Oscillator, Kurtosis, MACD, Momentum, Money Flow, OBV, PVO, RSI, RVI, Slope, Smoothed Mov Avg, S.A.R Function.
- Statistical: SPC Charts, Histograms, Skewness.
- Extended: Cross points, Correlation, Cumulative, Custom y=y(x), Exponential Trend, Fitting linearizable models, Performance, Perimeter, Polynomial fitting, Reducing number of points, RMS, Smoothing function, Std Deviation, Trendline, Variance.
Data Connectivity
You can easily create and/or connect to an existing database or dataset in your project.
Data Aware
Direct access to .NET data sources. Direct access to URL addressable Charts.
Custom Chart Tools
TeeChart includes a set of 40 tools like Annotation, Color banding with Transparency, Custom Lines, Page numbering, Crossbar cursor, Mouseover tips, Background image display, Mousedrag Chart rotation, Point drag and nearest point information.
Palette Components
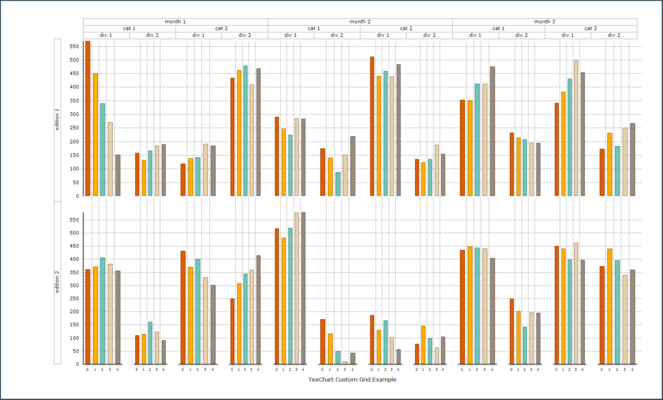
The Palette provides access to 30 toolkit-specific components including ChartGrid, Navigators, Web source and Control Bar.
Chart Image Filters
You have control over the aesthetics of the charts with a set of 25 image filters.
Exporting Formats
You can easily export charts as images (bitmap, metafile, JPEG, PNG, GIF, TIFF, PDF, SVG, EPS and native Chart format) and as data to Excel, XML, HTML, CSV (Text) and native Chart format. Builds and exports to Flash via Flex compiler. Stream export/import capability for BLOB storage and direct output to client (e.g. browser).
Multiple Languages
TeeChart forms and string constants translated to 29 languages. The translation can be used at design-time and run-time.
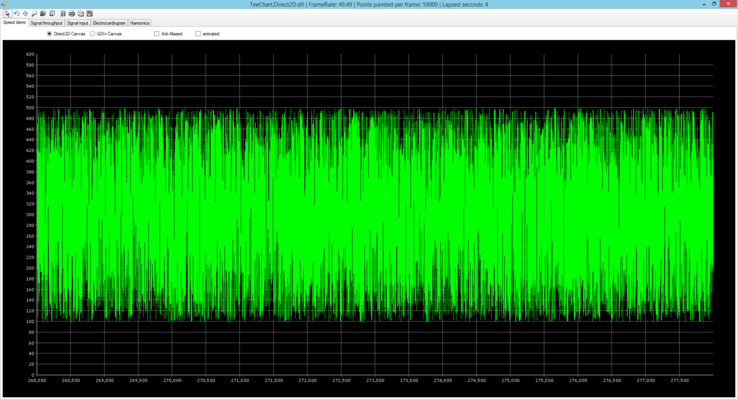
Fast and Memory Efficient
Direct high-speed addition of Array data to the Chart making TeeChart for .NET very quick! Very quick!
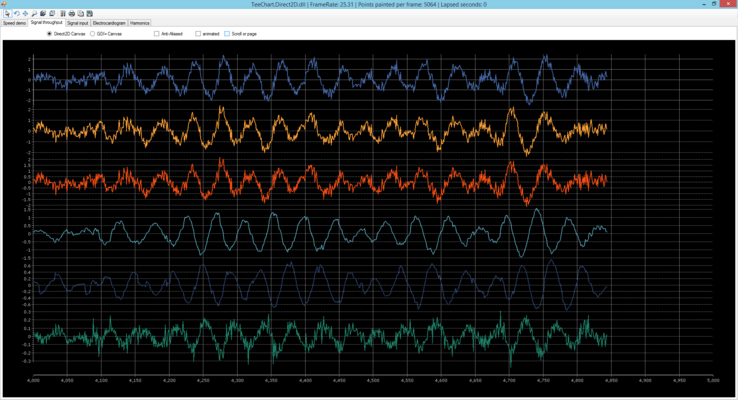
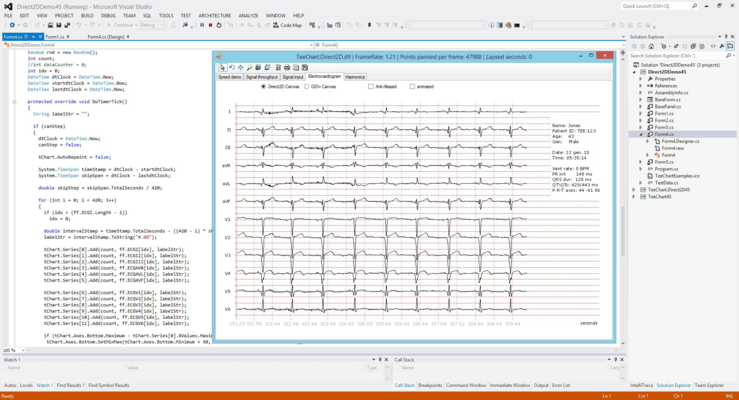
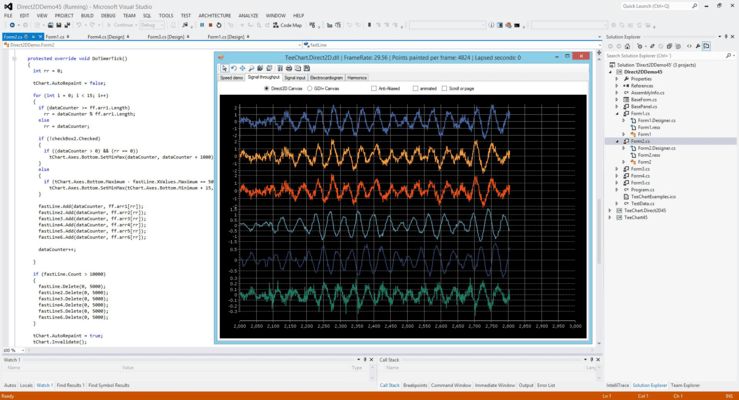
Digital Signal Processing Module
TeeChart now ships with a Direct2D rendering engine. This is ideal for the high speed data throughput required by DSP realtime applications.
Multiple Axes
Use the Chart Editor to add and setup Multiple Axes or add them at runtime. Virtually unlimited Axes may be added and independently configured.
Interactive Zooming and Scrolling
Charts can be scrolled and zoomed using the mouse or by code at runtime. Zoom and scroll features can be customized using chart properties and events.
Chart Themes
Includes 14 predefined themes enabling rapid change of many chart properties with a single mouse click.
Visual Attributes
Color palette management, Transparency and anti-aliasing on all Chart object Pens, Brushes, Fonts and Gradients. Custom 3D Drawing Objects.
Comprehensive Support
Tech support provided via Steema online Forums. Optional Professional-level technical support gives the subscriber a priority support link into Steema.
Royalty Free
You may distribute your charts royalty-free for use in compiled desktop applications.
Help and Documentation
Includes Extensive demos for Visual Studio.NET including WinForms, ASP.NET WebForms and Compact Framework, code examples, Tutorials, blog articles, TeeChart wiki, etc.
WebForm charts rendering as HTML5 Javascript charts.
Many indicators designed to track financial data.

Use multiple axes on charts.

WPF, Silverlight, ASP.NET, Flash, CF, Winforms, Reporting Services
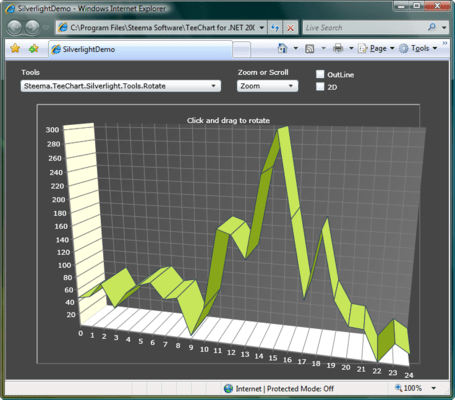
Chart Series Types
Gauges
Design Time integrated Chart and Series editor
GIS Mapping
Signal Throughput
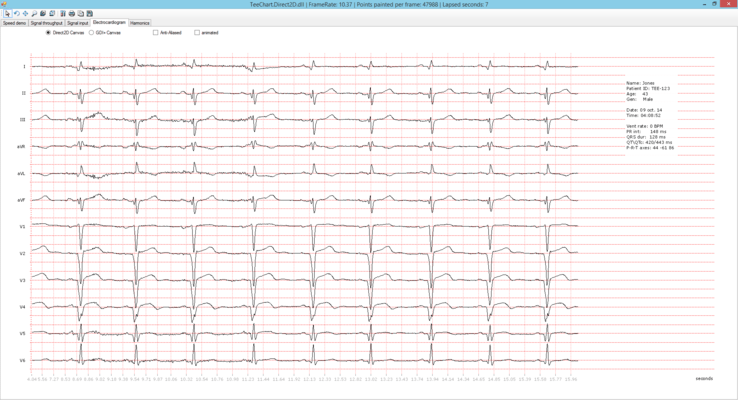
Electrocardiogram
High Speed
Combination Gauges

Linear Gauge
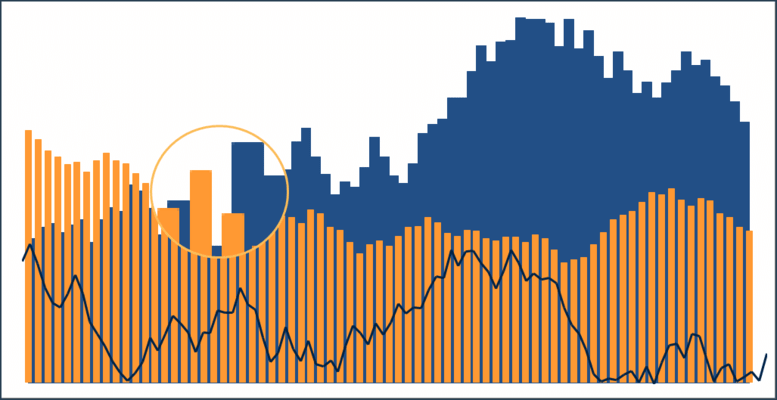
Background Chart
Financial MACD Chart
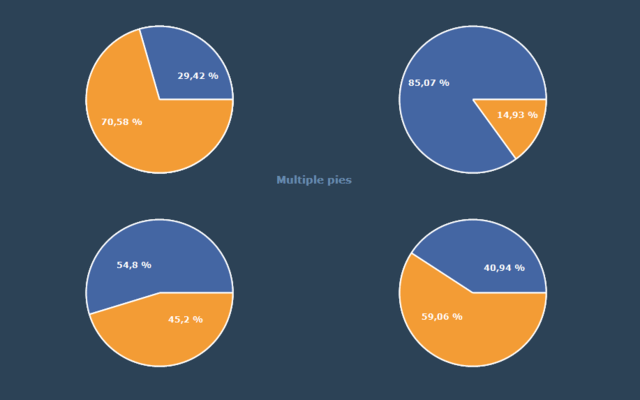
Multiple Pies Chart
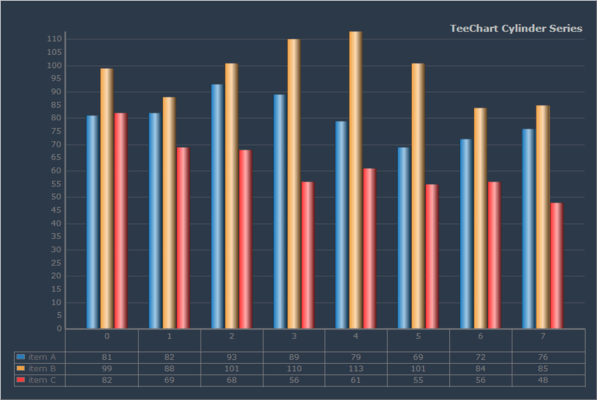
Cylinder Chart
Surface Chart
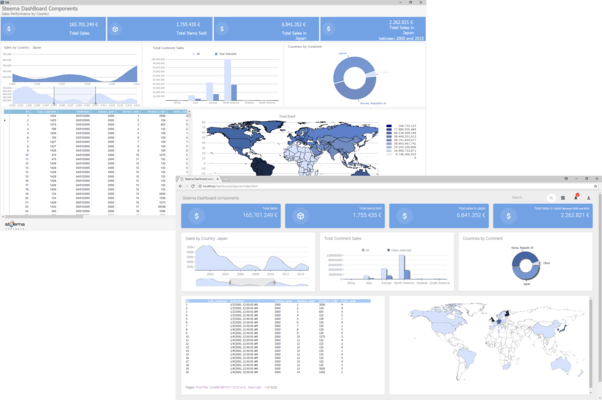
Windows Dashboard
Technical
Fibonacci Arcs
Geographic
Statistics
Smith Chart
Ternary Chart
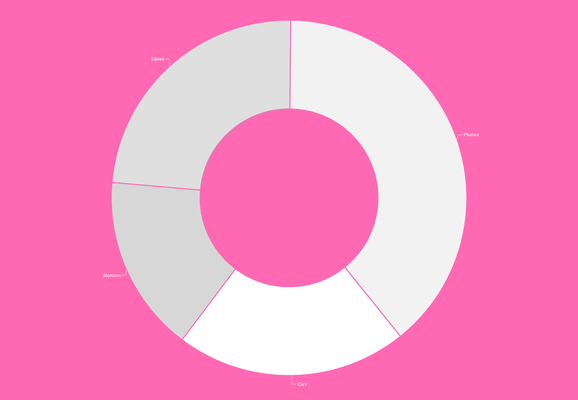
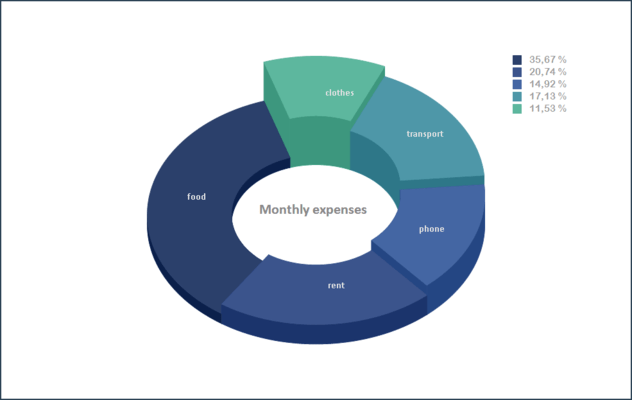
Donut Chart
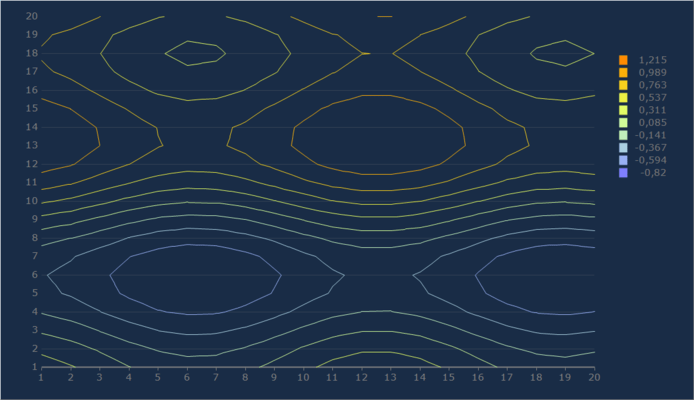
Contour Chart
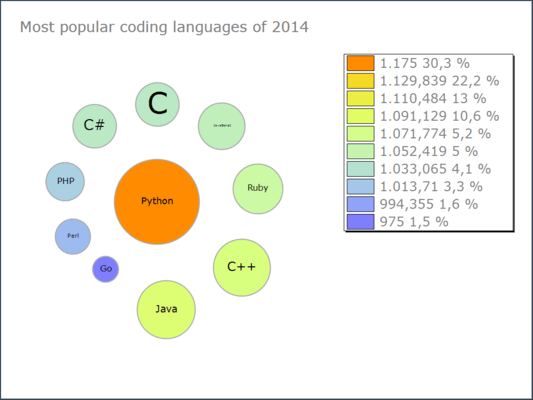
Bubble Cloud
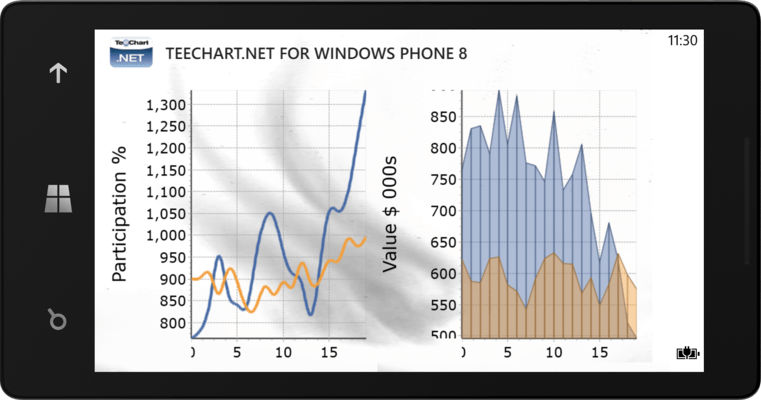
MultiChart

Weather
ASPNET Pie Chart

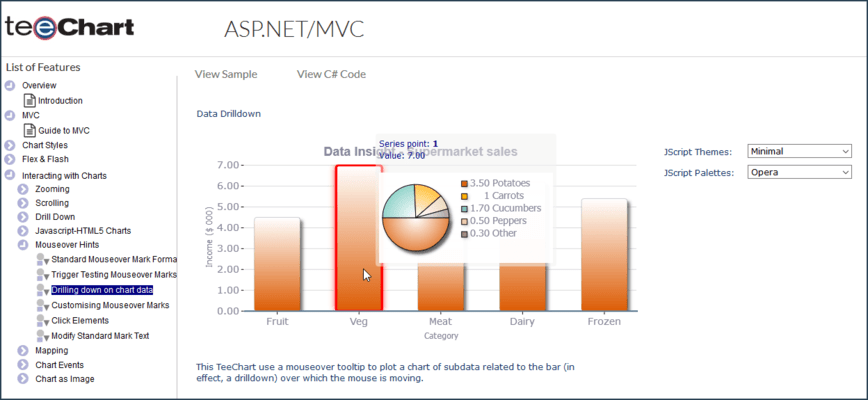
ASPNET MVC Interpolation Chart

ASPNET Chart Drilldown
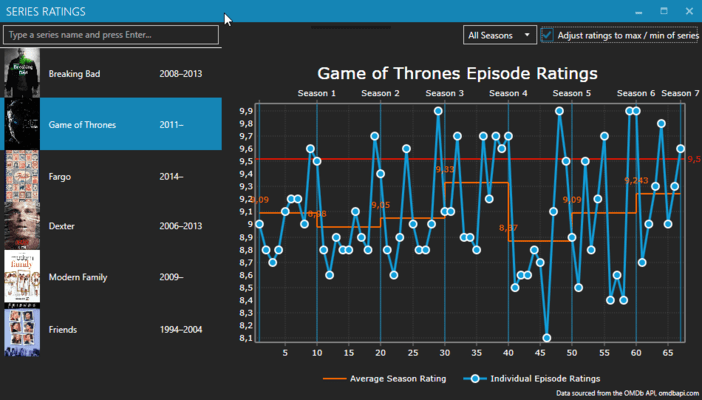
Series ratings Chart
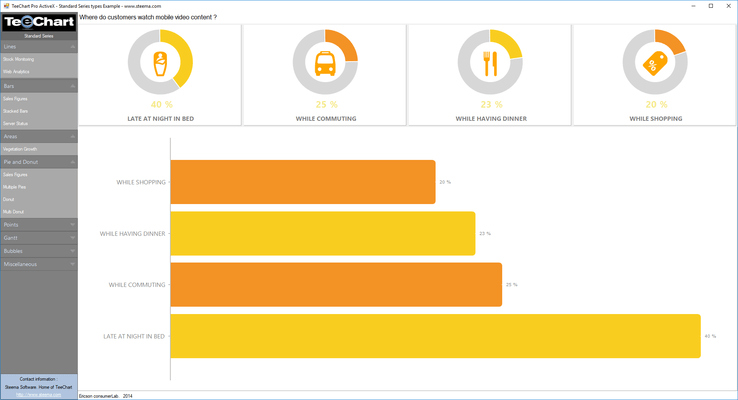
InfoGraphic
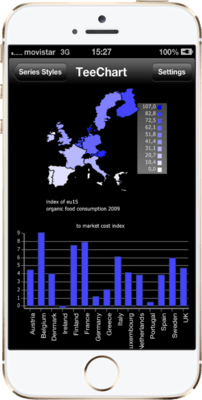
Map Chart
3D Surface Chart
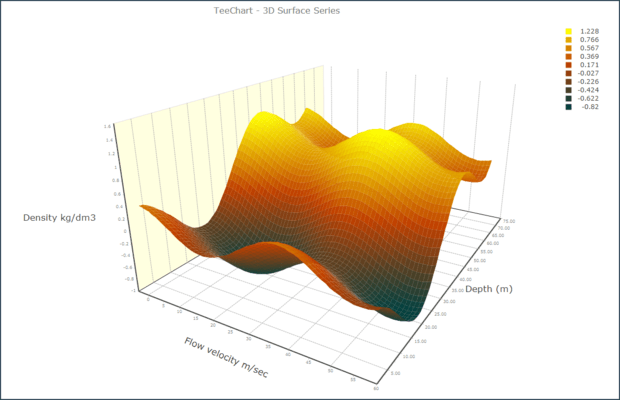
3D Surface Chart
Stacked Bar Chart

Radar Chart
Business Intelligence (BI)
.png)
Polar Chart
Stepped Pie
Line Chart
Magnify Chart Tool
Multiple Axes
Point and Figure Function
Area Chart
Financial EquiVolume function
Pie Chart XamarinAndroid
Technical Analysis
Cardio VSNET
Direct2D VSNET
Maps VSNET

Financial Chart
PieLight VSNET
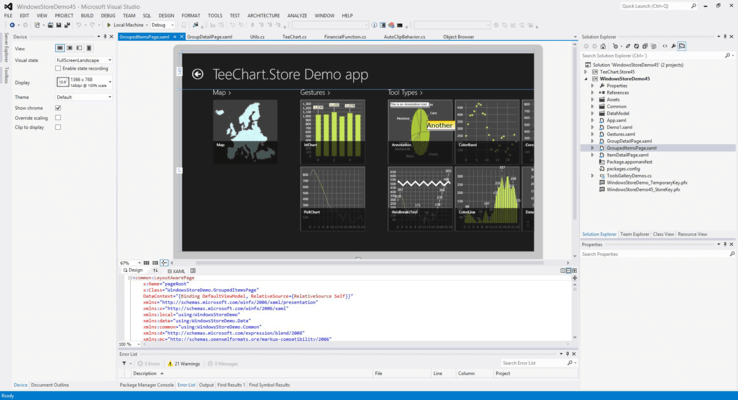
Store VSNET