Telerik Kendo UI
JavaScript UI 开发框架,控件多且视觉效果出众
以下是 "Charts",如果您需要了解更多信息,您可以联系我们。
所有基本图表类型
Kendo UI 支持所有常用的图表类型:光滑、交互性和跨所有平台和设备的一致性。
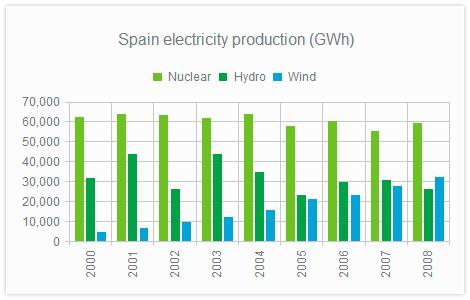
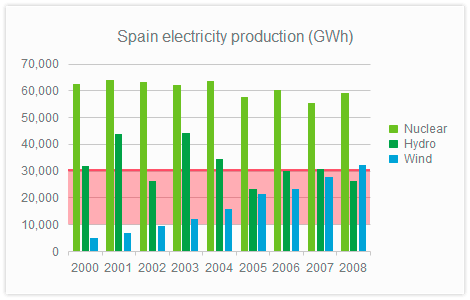
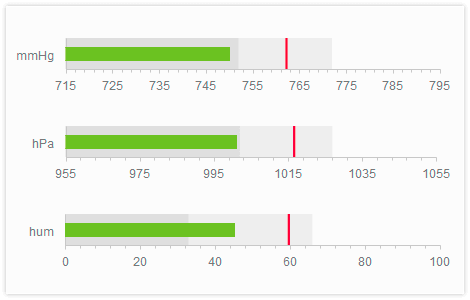
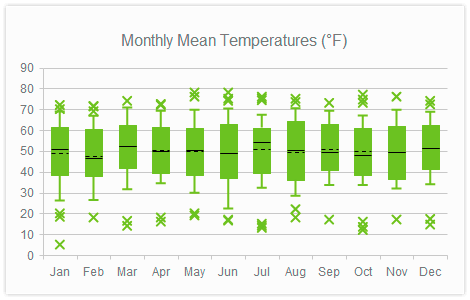
BarorRadarto compare several data setsPieorDonutchart to visualize a piece of data as part of a wholeLineorAreato monitor trendsBulletchart to compare quantitative against qualitative measuresScatterorBubbleto visualize the correlation in a set of engineering dataBox Plotto graphically depict your statistical dataWaterfallto represent cumulative effect of consecutive positive or negative valuesRangeBarto visualize value ranges over timeFunnelto represent the stages in a processPolarto plot engineering data in a polar coordinate systemSparklinesto provide context to your data
绑定本、远程和分组数据
使用一些属性将您的 Kendo UI 图表绑定到最适合您的项目的数据源:本地数据、远程数据或分组数据。
多种数据类型
Kendo UI Charts 支持各种数据类型。根据图表类型,数值数据可以在X轴上分布显示数字、类别(字符串)或时间点(日期时间)。
更好的客户端输出性能
Kendo UI Chart 完全通过JavaScript呈现,因此是服务器平台不可知的,并且提高了应用程序的性能。
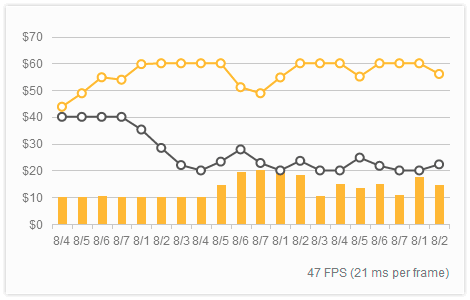
默认情况下,组件使用 Scalable Vector Graphics(SVG)方式渲染,允许现代浏览器中的动画和交互性使用旧版本浏览器的矢量标记语言(VML)。当频繁/实时数据更新需要更高的FPS速率时采用 Canvas 绘 制。
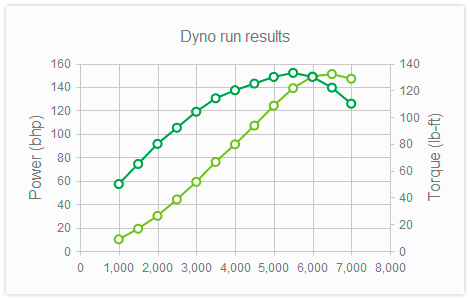
多轴多系列
为了实现对数据的更全面和更翔实的使用,Kendo UI Chart 还提供了自由组合类似图表类型并显示多个系列。您还可以定义多个轴值,以提供一个以上的数值刻度数据。
MVVM 和 Client API 提高使用灵活性
响应用户行为,或者通过处理 hover 和单击该系列上触发的客户端事件,或者通过 MVVM 使用UI和数据的双向绑定来构建核心图表功能,为了实现自定义功能,只需使用暴露的参数即可。