ZingChart
用数十万条数据记录创建动画和交互式图表。
以下是 "v2.9.0",如果您需要了解更多信息,您可以联系我们。
04/20/2020
功能增加
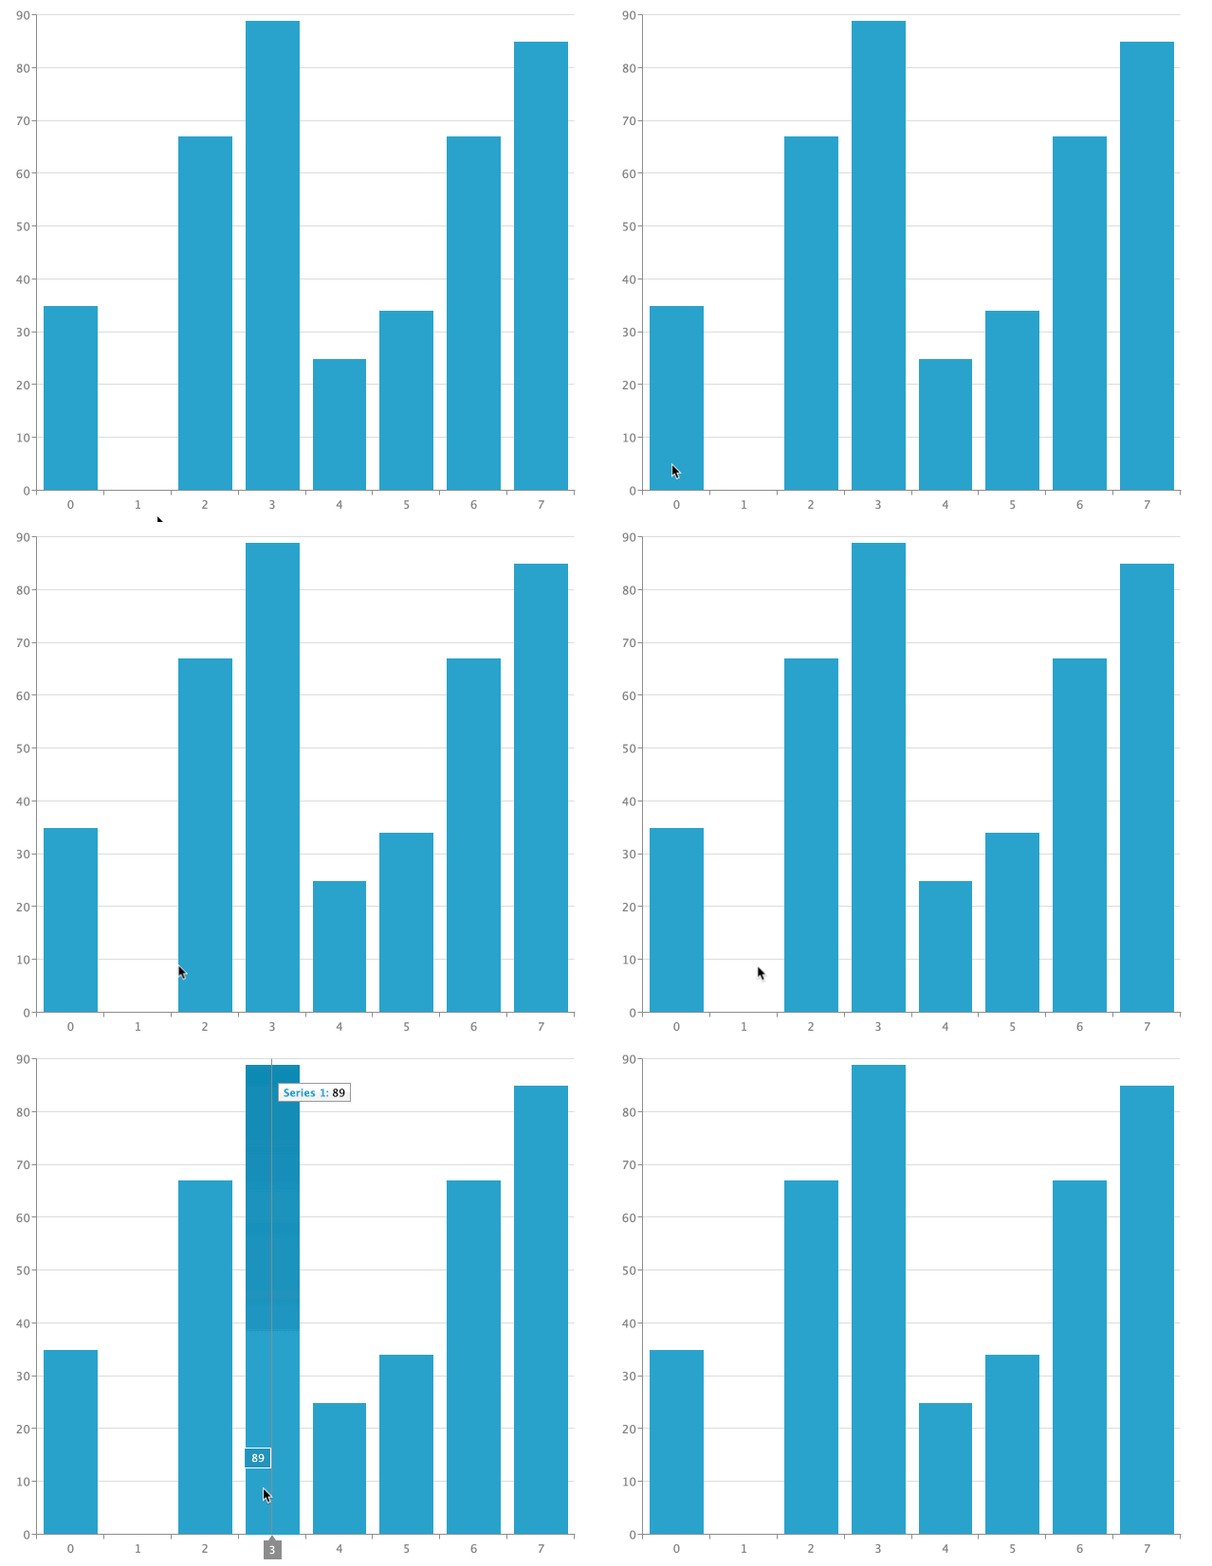
jsRule attribute can now be applied on main crosshairX and crosshairY objects, allowing crosshair line customization. This feature will allow you more flexible styling of crosshairs based on chart values. Like hiding the crosshair if the value is null Crosshair Y

Custom data tokens can now be added on dynamic labels using %plot-IDX-data-customname constructs. This is good to display plot information in a static label.
Implemented display logic for overlapping scaleX crosshair items (alpha applied on obscured elements).
plot_click event information includes now plottext attribute.
Notable Fixes
- Added plotid as parameter for select and deselect API's.
- Fixed issue with bubble pack labels.
- Tilemap plugin fixes
- Fixed positioning issues.
- Fixed ability to use multiple tilemaps in same graphset.
- Fixed issue when zooming range chart with spline aspect.
- Fixed issue with maps flipping when negative zoom is applied.
- Fixed formatting issues on value-box objects.
- Added support for custom data-xxx tokens in sunburst charts.
- Fixed navigation reset on sunburst when the chart is deleted and reloaded with a different data.
- Fixed bug with timestamp formatting on data table view and data export when timezone parameter is used.
- Fixed issue with sorting crosshair plots by value when using "sort-by-value" : "asc" | "desc"attribute.
- Fixed issue with objects API not working when applied directly on map elements.
- Fixed broken scrolling logic on charts with y-axis scrolling
