
FusionCharts
超过118个国家的2.8万家客户使用 FusionCharts
以下是 "jQuery Sample",如果您需要了解更多信息,您可以联系我们。
使用 jQuery 的例子
$("#chart-container").insertFusionCharts({
type: "mscolumn2d",
width: "100%",
height: "100%",
dataFormat: "json",
dataSource: {
chart: {
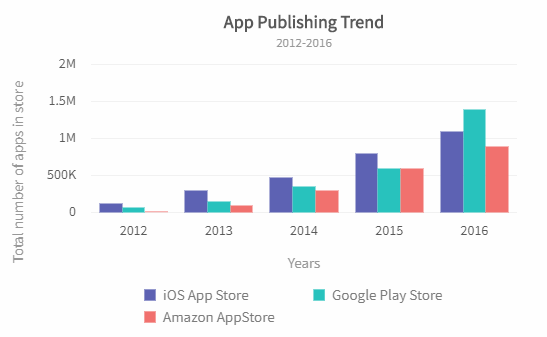
caption: "App Publishing Trend",
subcaption: "2012-2016",
xaxisname: "Years",
yaxisname: "Total number of apps in store",
formatnumberscale: "1",
plottooltext:
"$dataValue apps were available on $seriesName in $label",
theme: "fusion",
drawcrossline: "1"
},
categories: [
{
category: [
{
label: "2012"
},
{
label: "2013"
},
{
label: "2014"
},
{
label: "2015"
},
{
label: "2016"
}
]
}
],
dataset: [
{
seriesname: "iOS App Store",
data: [
{
value: "125000"
},
{
value: "300000"
},
{
value: "480000"
},
{
value: "800000"
},
{
value: "1100000"
}
]
},
{
seriesname: "Google Play Store",
data: [
{
value: "70000"
},
{
value: "150000"
},
{
value: "350000"
},
{
value: "600000"
},
{
value: "1400000"
}
]
},
{
seriesname: "Amazon AppStore",
data: [
{
value: "10000"
},
{
value: "100000"
},
{
value: "300000"
},
{
value: "600000"
},
{
value: "900000"
}
]
}
]
}
});