
FusionCharts 发布 3.13.1
日期:2018/8/10
缺陷修复
- 图表运行时当改变
chartType抛出错误; - 当地图别名前缀带有路径(如“maps/”)向下钻取图表不能能渲染图;
- 属性
displayValue设置为“ ”(空格),现在trend line的开始值是0的时候可以正常运行; - 旧IE浏览器(VML)中的渲染图相关的问题已经得到纠正;
Funnel和Pyramid图表中用setChartAttribute改变图表主题问题已经得到解决;3D Pie图中应用调色板颜色改变主题的问题已矫正;- 针对多轴的
Line chart,改变图表主题时的图列现在可以正常更新; - 针对
Stacked Column chart,改变图表主题时Crossline颜色可以正常更新; - Thermometer 图形在更新 Fusion, Gammel 或者 Candy 主题时能够正常刷新背景;
- 统一的工具提示现在可以安全地使用<div>元素来定义工具文本;
Pie/Doughnut图表现在可以正常animateClockwise;
v3.13 中的新功能
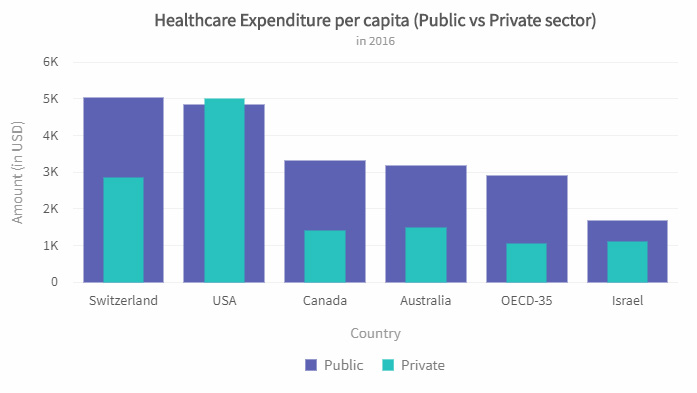
重叠的 Column 2D 和 Bar 2D Chart
FusionCharts v3.13 引入了重叠的条形和柱形图表。
- 重叠的 Column 2D Chart
- 重叠的 Bar 2D Chart
重叠的 2D柱形例子
代码
<html>
<head>
<title>My first chart using FusionCharts Suite XT</title>
<script type="text/javascript" src="https://cdn.fusioncharts.com/fusioncharts/latest/fusioncharts.js"></script>
<script type="text/javascript" src="https://cdn.fusioncharts.com/fusioncharts/latest/themes/fusioncharts.theme.fusion.js"></script>
<script type="text/javascript">
    FusionCharts.ready(function(){
    var fusioncharts = new FusionCharts({
    type: "overlappedColumn2d",
    renderAt: "chartContainer",
    width: "700",
    height: "400",
    dataFormat: "json",
    dataSource: {
        "chart": {
            "caption": "Healthcare Expenditure per capita (Public vs Private sector)",
            "subCaption": "in 2016",
            "xAxisName": "Country",
            "yAxisName": "Amount (in USD)",
            "showValues": "0",
            "theme": "fusion"
        },
        "categories": [{
            "category": [{
                "label": "Switzerland"
            }, {
                "label": "USA"
            }, {
                "label": "Canada"
            }, {
                "label": "Australia"
            }, {
                "label": "OECD-35"
            }, {
                "label": "Israel"
            }]
        }],
        "dataset": [{
            "seriesname": "Public",
            "data": [{
                "value": "5038"
            }, {
                "value": "4860"
            }, {
                "value": "3341"
            }, {
                "value": "3190"
            }, {
                "value": "2937"
            }, {
                "value": "1702"
            }]
        }, {
            "seriesname": "Private",
            "data": [{
                "value": "2881"
            }, {
                "value": "5032"
            }, {
                "value": "1412"
            }, {
                "value": "1518"
            }, {
                "value": "1066"
            }, {
                "value": "1120"
            }]
        }]
    }
});
    fusioncharts.render();
    });
</script>
</head>
<body>
    <div id="chart-container">FusionCharts XT will load here!</div>
</body>
</html>
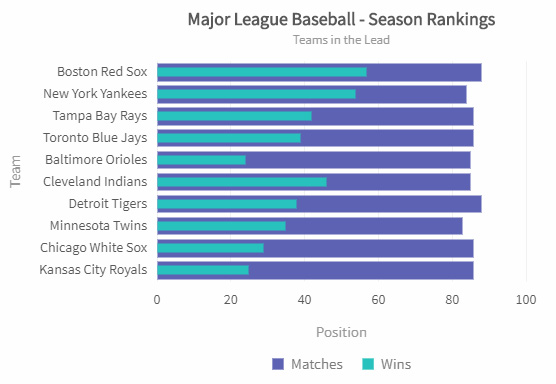
重叠的2D条形图。
代码
<html>
<head>
<title>My first chart using FusionCharts Suite XT</title>
<script type="text/javascript" src="https://cdn.fusioncharts.com/fusioncharts/latest/fusioncharts.js"></script>
<script type="text/javascript" src="https://cdn.fusioncharts.com/fusioncharts/latest/themes/fusioncharts.theme.fusion.js"></script>
<script type="text/javascript">
    FusionCharts.ready(function(){
    var fusioncharts = new FusionCharts({
    "type": "overlappedBar2d",
    "renderAt": "chartContainer",
    "width": "550",
    "height": "400",
    "dataFormat": "json",
    "dataSource": {
        "chart": {
            "caption": "Major League Baseball - Season Rankings",
            "subCaption": "Teams in the Lead",
            "xAxisName": "Team",
            "yAxisName": "Position",
            "theme": "fusion",
            "showValues": "0"
        },
        "categories": [{
            "category": [{
                "label": "Boston Red Sox"
            }, {
                "label": "New York Yankees"
            }, {
                "label": "Tampa Bay Rays"
            }, {
                "label": "Toronto Blue Jays"
            }, {
                "label": "Baltimore Orioles"
            }, {
                "label": "Cleveland Indians"
            }, {
                "label": "Detroit Tigers"
            }, {
                "label": "Minnesota Twins"
            }, {
                "label": "Chicago White Sox"
            }, {
                "label": "Kansas City Royals"
            }]
        }],
        "dataset": [{
            "seriesname": "Matches",
            "data": [{
                "value": "88"
            }, {
                "value": "84"
            }, {
                "value": "86"
            }, {
                "value": "86"
            }, {
                "value": "85"
            }, {
                "value": "85"
            }, {
                "value": "88"
            }, {
                "value": "83"
            }, {
                "value": "86"
            }, {
                "value": "86"
            }]
        }, {
            "seriesname": "Wins",
            "data": [{
                "value": "57"
            }, {
                "value": "54"
            }, {
                "value": "42"
            }, {
                "value": "39"
            }, {
                "value": "24"
            }, {
                "value": "46"
            }, {
                "value": "38"
            }, {
                "value": "35"
            }, {
                "value": "29"
            }, {
                "value": "25"
            }]
        }]
    }
});
    fusioncharts.render();
    });
</script>
</head>
<body>
    <div id="chart-container">FusionCharts XT will load here!</div>
</body>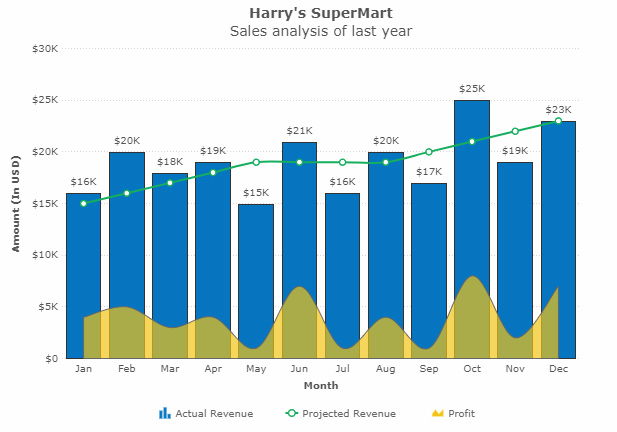
</html>Spline样条曲线图和Spline面积图组合到一个图表。
代码
<html>
<head>
<title>My first chart using FusionCharts Suite XT</title>
<script type="text/javascript" src="https://cdn.fusioncharts.com/fusioncharts/latest/fusioncharts.js"></script>
<script type="text/javascript" src="https://cdn.fusioncharts.com/fusioncharts/latest/themes/fusioncharts.theme.fusion.js"></script>
<script type="text/javascript">
    FusionCharts.ready(function(){
    var fusioncharts = new FusionCharts({
    type: 'mscombi2d',
    renderAt: 'chart-container',
    width: '600',
    height: '450',
    dataFormat: 'json',
    dataSource: {
        "chart": {
            "caption": "Harry's SuperMart",
            "subCaption": "Sales analysis of last year",
            "xAxisname": "Month",
            "yAxisName": "Amount (In USD)",
            "numberPrefix": "$",
            "showBorder": "0",
            "showValues": "0",
            "paletteColors": "#0075c2,#1aaf5d,#f2c500",
            "bgColor": "#ffffff",
            "showCanvasBorder": "0",
            "canvasBgColor": "#ffffff",
            "captionFontSize": "14",
            "subcaptionFontSize": "14",
            "subcaptionFontBold": "0",
            "divlineColor": "#999999",
            "divLineIsDashed": "1",
            "divLineDashLen": "1",
            "divLineGapLen": "1",
            "showAlternateHGridColor": "0",
            "usePlotGradientColor": "0",
            "toolTipColor": "#ffffff",
            "toolTipBorderThickness": "0",
            "toolTipBgColor": "#000000",
            "toolTipBgAlpha": "80",
            "toolTipBorderRadius": "2",
            "toolTipPadding": "5",
            "legendBgColor": "#ffffff",
            "legendBorderAlpha": '0',
            "legendShadow": '0',
            "legendItemFontSize": '10',
            "legendItemFontColor": '#666666'
        },
        "categories": [{
            "category": [
                {
                    "label": "Jan"
                },
                {
                    "label": "Feb"
                },
                {
                    "label": "Mar"
                },
                {
                    "label": "Apr"
                },
                {
                    "label": "May"
                },
                {
                    "label": "Jun"
                },
                {
                    "label": "Jul"
                },
                {
                    "label": "Aug"
                },
                {
                    "label": "Sep"
                },
                {
                    "label": "Oct"
                },
                {
                    "label": "Nov"
                },
                {
                    "label": "Dec"
                }
            ]
        }],
        "dataset": [{
            "seriesName": "Actual Revenue",
            "showValues": "1",
            "data": [{
                "value": "16000"
            },
            {
                "value": "20000"
            },
            {
                "value": "18000"
            },
            {
                "value": "19000"
            },
            {
                "value": "15000"
            },
            {
                "value": "21000"
            },
            {
                "value": "16000"
            },
            {
                "value": "20000"
            },
            {
                "value": "17000"
            },
            {
                "value": "25000"
            },
            {
                "value": "19000"
            },
            {
                "value": "23000"
            }]
        },
        {
            "seriesName": "Projected Revenue",
            "renderAs": "spline",
            "data": [{
                "value": "15000"
            },
            {
                "value": "16000"
            },
            {
                "value": "17000"
            },
            {
                "value": "18000"
            },
            {
                "value": "19000"
            },
            {
                "value": "19000"
            },
            {
                "value": "19000"
            },
            {
                "value": "19000"
            },
            {
                "value": "20000"
            },
            {
                "value": "21000"
            },
            {
                "value": "22000"
            },
            {
                "value": "23000"
            }]
        },
        {
            "seriesName": "Profit",
            "renderAs": "splineArea",
            "data": [{
                "value": "4000"
            },
            {
                "value": "5000"
            },
            {
                "value": "3000"
            },
            {
                "value": "4000"
            },
            {
                "value": "1000"
            },
            {
                "value": "7000"
            },
            {
                "value": "1000"
            },
            {
                "value": "4000"
            },
            {
                "value": "1000"
            },
            {
                "value": "8000"
            },
            {
                "value": "2000"
            },
            {
                "value": "7000"
            }]
        }]
    }
});
    fusioncharts.render();
    });
</script>
</head>
<body>
    <div id="chart-container">FusionCharts XT will load here!</div>
</body>
</html>
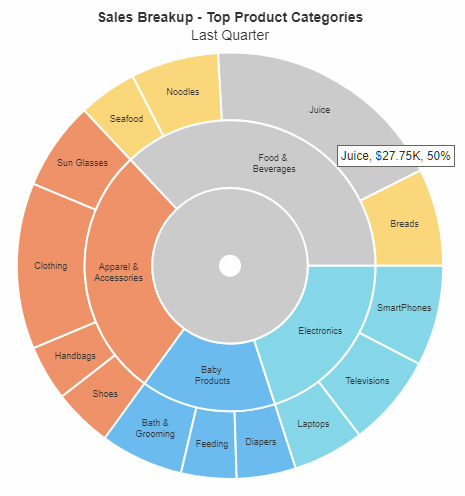
多级饼图高亮特效
代码
<html>
<head>
<title>My first chart using FusionCharts Suite XT</title>
<script type="text/javascript" src="https://cdn.fusioncharts.com/fusioncharts/latest/fusioncharts.js"></script>
<script type="text/javascript" src="https://cdn.fusioncharts.com/fusioncharts/latest/themes/fusioncharts.theme.fusion.js"></script>
<script type="text/javascript">
    FusionCharts.ready(function(){
    var fusioncharts = new FusionCharts({
    type: 'multilevelpie',
    renderAt: 'chart-container',
    width: '500',
    height: '500',
    dataFormat: 'json',
    dataSource: {
      "chart": {
        "caption": "Sales Breakup - Top Product Categories",
        "subCaption": "Last Quarter",
        "captionFontSize": "14",
        "subcaptionFontSize": "14",
        "baseFontColor": "#333333",
        "baseFont": "Helvetica Neue,Arial",
        "basefontsize": "9",
        "subcaptionFontBold": "0",
        "bgColor": "#ffffff",
        "canvasBgColor": "#ffffff",
        "showBorder": "0",
        "showShadow": "0",
        "showCanvasBorder": "0",
        "pieFillAlpha": "60",
        "pieBorderThickness": "2",
        "hoverFillColor": "#cccccc",
        "pieBorderColor": "#ffffff",
        "useHoverColor": "1",
        "showValuesInTooltip": "1",
        "showPercentInTooltip": "0",
        "numberPrefix": "$",
        "plotTooltext": "$label, $$valueK, $percentValue",
        "innerRadius": "10"
      },
      "category": [{
        "color": "#ffffff",
        "value": "150",
        "category": [{
            "label": "Food & {br}Beverages",
            "color": "#f8bd19",
            "value": "55.5",
            "category": [{
                "label": "Breads",
                "color": "#f8bd19",
                "value": "11.1"
              },
              {
                "label": "Juice",
                "color": "#f8bd19",
                "value": "27.75"
              },
              {
                "label": "Noodles",
                "color": "#f8bd19",
                "value": "9.99"
              },
              {
                "label": "Seafood",
                "color": "#f8bd19",
                "value": "6.66"
              }
            ]
          },
          {
            "label": "Apparel &{br}Accessories",
            "color": "#e44a00",
            "value": "42",
            "category": [{
                "label": "Sun Glasses",
                "color": "#e44a00",
                "value": "10.08"
              },
              {
                "label": "Clothing",
                "color": "#e44a00",
                "value": "18.9"
              },
              {
                "label": "Handbags",
                "color": "#e44a00",
                "value": "6.3"
              },
              {
                "label": "Shoes",
                "color": "#e44a00",
                "value": "6.72"
              }
            ]
          },
          {
            "label": "Baby {br}Products",
            "color": "#008ee4",
            "value": "22.5",
            "category": [{
                "label": "Bath &{br}Grooming",
                "color": "#008ee4",
                "value": "9.45"
              },
              {
                "label": "Feeding",
                "color": "#008ee4",
                "value": "6.3"
              },
              {
                "label": "Diapers",
                "color": "#008ee4",
                "value": "6.75"
              }
            ]
          },
          {
            "label": "Electronics",
            "color": "#33bdda",
            "value": "30",
            "category": [{
                "label": "Laptops",
                "color": "#33bdda",
                "value": "8.1"
              },
              {
                "label": "Televisions",
                "color": "#33bdda",
                "value": "10.5"
              },
              {
                "label": "SmartPhones",
                "color": "#33bdda",
                "value": "11.4"
              }
            ]
          }
        ]
      }]
    }
  });
    fusioncharts.render();
    });
</script>
</head>
<body>
    <div id="chart-container">FusionCharts XT will load here!</div>
</body>
</html>
另外 Multi-level pie chart 支持导出数据到 CSV 或 XLS 格式。
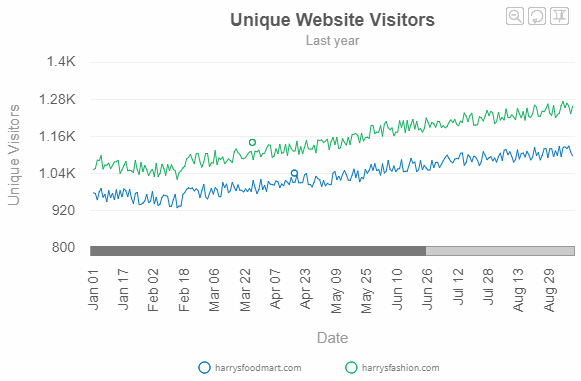
设置 Zoomline Chart 的限制
在版本 3.13.0 中,maxPeakDataLimit 和 minPeakDataLimit属性的行为在zoomline charts中已经更新。值大于maxPeakDataLimit将被认为是峰值数据,相反值小于minPeakDataLimit也将被视为峰值数据,并将他们包含在初始化数据集中。
代码
<html>
<head>
<title>My first chart using FusionCharts Suite XT</title>
<script type="text/javascript" src="https://cdn.fusioncharts.com/fusioncharts/latest/fusioncharts.js"></script>
<script type="text/javascript" src="https://cdn.fusioncharts.com/fusioncharts/latest/themes/fusioncharts.theme.fusion.js"></script>
<script type="text/javascript">
    FusionCharts.ready(function(){
    var fusioncharts = new FusionCharts({
    type: 'zoomline',
    renderAt: 'chart-container',
    width: '600',
    height: '400',
    dataFormat: 'json',
    dataSource: {
        "chart": {
            "caption": "Unique Website Visitors",
            "subcaption": "Last year",
            "paletteColors": "#0075c2,#1aaf5d",
            "baseFont": "Helvetica Neue,Arial",
            "yaxisname": "Unique Visitors",
            "xaxisname": "Date",
            "yaxisminValue": "800",
            "yaxismaxValue": "1400",
            "forceAxisLimits": "1",
            "pixelsPerPoint": "0",
            "pixelsPerLabel": "30",
            "lineThickness": "1",
            "compactdatamode": "1",
            "dataseparator": "|",
            "scrollheight": "10",
            "flatScrollBars": "1",
            "scrollShowButtons": "0",
            "scrollColor": "#cccccc",
            "legendItemFontSize": "10",
            "showPeakData": "1",
            "minPeakDataLimit": "1000",
            "maxPeakDataLimit": "900",
            "theme": "fusion"
        },
        "categories": [{
            "category": "Jan 01|Jan 02|Jan 03|Jan 04|Jan 05|Jan 06|Jan 07|Jan 08|Jan 09|Jan 10|Jan 11|Jan 12|Jan 13|Jan 14|Jan 15|Jan 16|Jan 17|Jan 18|Jan 19|Jan 20|Jan 21|Jan 22|Jan 23|Jan 24|Jan 25|Jan 26|Jan 27|Jan 28|Jan 29|Jan 30|Jan 31|Feb 01|Feb 02|Feb 03|Feb 04|Feb 05|Feb 06|Feb 07|Feb 08|Feb 09|Feb 10|Feb 11|Feb 12|Feb 13|Feb 14|Feb 15|Feb 16|Feb 17|Feb 18|Feb 19|Feb 20|Feb 21|Feb 22|Feb 23|Feb 24|Feb 25|Feb 26|Feb 27|Feb 28|Mar 01|Mar 02|Mar 03|Mar 04|Mar 05|Mar 06|Mar 07|Mar 08|Mar 09|Mar 10|Mar 11|Mar 12|Mar 13|Mar 14|Mar 15|Mar 16|Mar 17|Mar 18|Mar 19|Mar 20|Mar 21|Mar 22|Mar 23|Mar 24|Mar 25|Mar 26|Mar 27|Mar 28|Mar 29|Mar 30|Mar 31|Apr 01|Apr 02|Apr 03|Apr 04|Apr 05|Apr 06|Apr 07|Apr 08|Apr 09|Apr 10|Apr 11|Apr 12|Apr 13|Apr 14|Apr 15|Apr 16|Apr 17|Apr 18|Apr 19|Apr 20|Apr 21|Apr 22|Apr 23|Apr 24|Apr 25|Apr 26|Apr 27|Apr 28|Apr 29|Apr 30|May 01|May 02|May 03|May 04|May 05|May 06|May 07|May 08|May 09|May 10|May 11|May 12|May 13|May 14|May 15|May 16|May 17|May 18|May 19|May 20|May 21|May 22|May 23|May 24|May 25|May 26|May 27|May 28|May 29|May 30|May 31|Jun 01|Jun 02|Jun 03|Jun 04|Jun 05|Jun 06|Jun 07|Jun 08|Jun 09|Jun 10|Jun 11|Jun 12|Jun 13|Jun 14|Jun 15|Jun 16|Jun 17|Jun 18|Jun 19|Jun 20|Jun 21|Jun 22|Jun 23|Jun 24|Jun 25|Jun 26|Jun 27|Jun 28|Jun 29|Jun 30|Jul 01|Jul 02|Jul 03|Jul 04|Jul 05|Jul 06|Jul 07|Jul 08|Jul 09|Jul 10|Jul 11|Jul 12|Jul 13|Jul 14|Jul 15|Jul 16|Jul 17|Jul 18|Jul 19|Jul 20|Jul 21|Jul 22|Jul 23|Jul 24|Jul 25|Jul 26|Jul 27|Jul 28|Jul 29|Jul 30|Jul 31|Aug 01|Aug 02|Aug 03|Aug 04|Aug 05|Aug 06|Aug 07|Aug 08|Aug 09|Aug 10|Aug 11|Aug 12|Aug 13|Aug 14|Aug 15|Aug 16|Aug 17|Aug 18|Aug 19|Aug 20|Aug 21|Aug 22|Aug 23|Aug 24|Aug 25|Aug 26|Aug 27|Aug 28|Aug 29|Aug 30|Aug 31|Sep 01|Sep 02|Sep 03|Sep 04|Sep 05|Sep 06|Sep 07|Sep 08|Sep 09|Sep 10|Sep 11|Sep 12|Sep 13|Sep 14|Sep 15|Sep 16|Sep 17|Sep 18|Sep 19|Sep 20|Sep 21|Sep 22|Sep 23|Sep 24|Sep 25|Sep 26|Sep 27|Sep 28|Sep 29|Sep 30|Oct 01|Oct 02|Oct 03|Oct 04|Oct 05|Oct 06|Oct 07|Oct 08|Oct 09|Oct 10|Oct 11|Oct 12|Oct 13|Oct 14|Oct 15|Oct 16|Oct 17|Oct 18|Oct 19|Oct 20|Oct 21|Oct 22|Oct 23|Oct 24|Oct 25|Oct 26|Oct 27|Oct 28|Oct 29|Oct 30|Oct 31|Nov 01|Nov 02|Nov 03|Nov 04|Nov 05|Nov 06|Nov 07|Nov 08|Nov 09|Nov 10|Nov 11|Nov 12|Nov 13|Nov 14|Nov 15|Nov 16|Nov 17|Nov 18|Nov 19|Nov 20|Nov 21|Nov 22|Nov 23|Nov 24|Nov 25|Nov 26|Nov 27|Nov 28|Nov 29|Nov 30|Dec 01|Dec 02|Dec 03|Dec 04|Dec 05|Dec 06|Dec 07|Dec 08|Dec 09|Dec 10|Dec 11|Dec 12|Dec 13|Dec 14|Dec 15|Dec 16|Dec 17|Dec 18|Dec 19|Dec 20|Dec 21|Dec 22|Dec 23|Dec 24|Dec 25|Dec 26|Dec 27|Dec 28|Dec 29|Dec 30|Dec 31"
        }],
        "dataset": [{
                "seriesname": "harrysfoodmart.com",
                "data": "978|976|955|981|992|964|973|949|985|962|977|955|988|959|985|965|991|985|966|989|960|944|976|980|940|941|945|952|973|946|951|983|942|964|937|942|963|971|969|967|934|935|956|974|930|936|935|973|979|990|994|992|994|984|991|986|963|985|1006|965|958|976|993|974|995|989|966|965|1011|995|1007|978|985|1012|997|985|1004|987|986|981|991|982|992|983|1018|994|976|989|1022|989|1002|983|1015|1006|1005|1003|1017|1014|995|1007|1001|1019|1012|1005|1027|1011|1013|1035|1010|1011|1011|1036|1041|1005|1005|997|1012|1032|1025|1020|998|1018|1000|1009|1005|1004|1042|1047|1021|1032|1019|1038|1050|1037|1019|1018|1035|1055|1028|1049|1013|1028|1023|1054|1041|1051|1069|1051|1072|1049|1054|1035|1072|1042|1048|1083|1054|1048|1065|1046|1055|1056|1085|1046|1048|1048|1068|1089|1074|1078|1046|1052|1082|1052|1067|1058|1051|1052|1082|1060|1076|1077|1059|1070|1082|1093|1100|1089|1079|1075|1087|1089|1088|1106|1107|1067|1076|1101|1094|1078|1097|1094|1083|1066|1079|1111|1100|1085|1091|1095|1081|1091|1077|1095|1107|1083|1116|1118|1101|1111|1096|1077|1086|1117|1087|1105|1107|1094|1112|1101|1084|1094|1125|1099|1108|1084|1099|1120|1122|1092|1120|1121|1094|1114|1099|1129|1095|1125|1127|1121|1129|1110|1097|1136|1110|1098|1131|1125|1144|1104|1117|1105|1105|1145|1102|1143|1115|1147|1149|1129|1108|1109|1130|1153|1121|1127|1133|1120|1155|1120|1147|1118|1117|1145|1152|1145|1130|1157|1135|1115|1156|1163|1131|1123|1137|1151|1160|1152|1166|1144|1137|1124|1151|1129|1133|1143|1139|1171|1135|1132|1174|1170|1163|1175|1152|1142|1160|1148|1173|1158|1160|1151|1142|1168|1153|1143|1157|1142|1172|1186|1176|1185|1175|1178|1184|1166|1148|1166|1186|1187|1180|1179|1161|1174|1155|1172|1173|1179|1149|1170|1175|1162|1151|1152|1163|1155|1197|1174|1199|1180|1160|1174|1159|1168|1160"

            },
            {
                "seriesname": "harrysfashion.com",
                "data": "1053|1057|1084|1082|1098|1055|1068|1067|1074|1056|1067|1078|1079|1084|1041|1052|1066|1080|1049|1051|1049|1044|1083|1053|1038|1077|1046|1067|1053|1033|1047|1055|1031|1074|1031|1041|1071|1057|1035|1070|1050|1069|1054|1049|1022|1044|1049|1058|1064|1088|1093|1103|1085|1072|1104|1106|1078|1061|1078|1105|1105|1062|1076|1074|1114|1069|1091|1086|1094|1072|1079|1088|1082|1075|1110|1120|1108|1102|1090|1088|1092|1102|1110|1111|1085|1113|1110|1116|1095|1105|1105|1122|1133|1132|1093|1097|1120|1105|1135|1106|1108|1135|1098|1136|1122|1113|1113|1145|1103|1127|1104|1126|1147|1120|1119|1120|1132|1107|1149|1147|1149|1141|1145|1152|1117|1144|1157|1134|1157|1120|1125|1153|1141|1132|1158|1134|1166|1167|1170|1163|1139|1171|1145|1156|1158|1154|1196|1196|1169|1174|1174|1195|1161|1201|1208|1188|1182|1188|1162|1174|1174|1211|1189|1211|1172|1211|1179|1199|1216|1184|1209|1181|1186|1174|1185|1220|1206|1190|1206|1201|1190|1209|1208|1189|1195|1188|1193|1206|1214|1205|1215|1200|1194|1210|1205|1236|1226|1208|1228|1235|1197|1197|1198|1224|1220|1210|1226|1244|1228|1241|1237|1201|1208|1238|1213|1222|1213|1249|1222|1221|1230|1223|1214|1251|1234|1220|1240|1213|1252|1224|1222|1234|1262|1255|1225|1226|1242|1240|1250|1265|1235|1228|1261|1221|1230|1235|1260|1273|1253|1268|1258|1233|1258|1248|1230|1270|1246|1242|1246|1253|1253|1257|1253|1266|1248|1247|1257|1245|1281|1271|1272|1248|1292|1251|1253|1257|1259|1288|1252|1297|1290|1268|1291|1258|1263|1254|1302|1279|1272|1271|1281|1261|1263|1289|1294|1272|1296|1264|1282|1268|1296|1280|1281|1277|1277|1292|1266|1310|1288|1312|1308|1300|1289|1273|1282|1300|1322|1301|1314|1296|1305|1305|1327|1323|1295|1314|1298|1312|1330|1293|1309|1286|1309|1332|1300|1295|1325|1322|1305|1323|1300|1308|1299|1324|1338|1313|1329|1331|1299|1329|1344|1335|1342|1307|1314|1326|1331|1328|1328|1311|1352|1328|1309|1311|1312"
            }
        ]
    }
});
    fusioncharts.render();
    });
</script>
</head>
<body>
    <div id="chart-container">FusionCharts XT will load here!</div>
</body>
</html>